In-Class Formative Assessment in an Introductory Calculus Class
urn:nbn:de:0009-5-51226
Abstract
We report on the usage of an audience response system ("clickers") in an introductory math course, both in terms of practical usage and in terms of answer distributions, test-theoretical properties and clustering of questions. We give examples of the questions ("items") that we used and their associated properties. We found the system to deliver meaningful and reliable results regarding the conceptual learning of the students, and we found these benefits to be robust independent of the particulars of the instructional setting. Finally we found that peer instruction can make clicker usage even more meaningful, as the discrimination of questions increases after discussions between learners.
Keywords: e-learning; audience response system; clicker system; higher education; math course;
Over the last decade, Classroom Response Systems (“clickers”) have found increasing adoption, as they give a chance to see whether what was explained was also understood. For the students this is beneficial, as they will not only detect difficulties, but also draw encouragement from having mastered a concept. For instructors it provides effective feedback, which can bring about surprises, as concepts may turn out to be harder or easier than expected; those realizations will improve the quality of lectures. Especially with large populations, it is otherwise hard to get a feeling for what learners have understood. Clickers were found to be meaningful in terms of test-theoretical measures and correlation to overall exam scores and individual exam problems (Kortemeyer, 2016).
Clickers are particularly effective in connection with peer instruction (Mazur, 1997; Crouch & Mazur, 2001; Fagen, Crouch, & Mazur, 2002; Keller et al., 2007; Lasry, Mazur & Watkins, 2008; Turpen & Finkelstein, 2009; Beatty & Gerace, 2009; Richardson, Dunn, McDonald & Oprescu, 2014; Barth-Cohen et al., 2015), where students respond to questions posed by the instructor, and based on voting outcome, in a second step, might discuss how to answer the questions with their neighbors and vote again. The students who believe they got it right on the first go (without guessing) will get an opportunity to express their thinking in words, which will enhance their understanding. And as peers they are probably the best instructors for those who may have gotten the question wrong in the first round, as concepts are now explained by people who just went through the process of understanding; students will remember the difficulties that needed to be overcome much better than we as instructors and experts in the field, but far away from initial understanding.
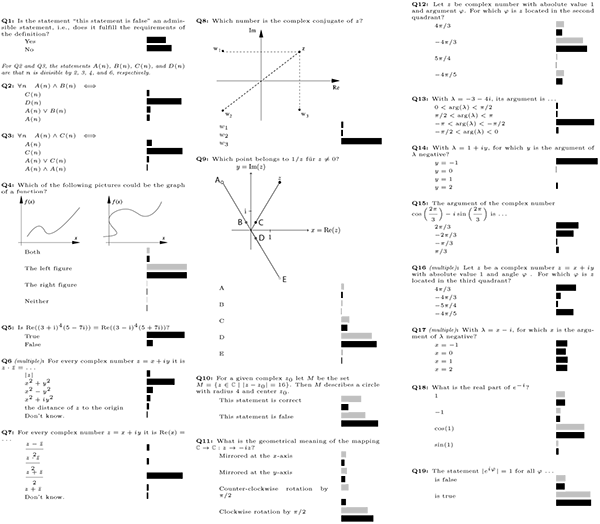
Figure 1: Clicker questions 1-19 (translated from German)(click to enlarge)
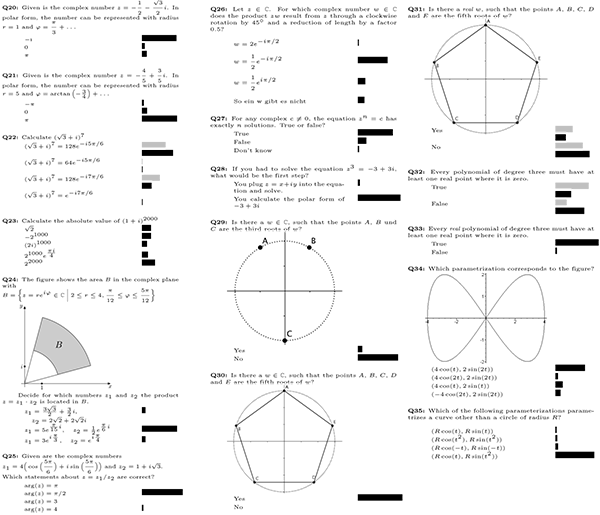
Figure 2: Clicker questions, 20-35 (translated from German)(click to enlarge)
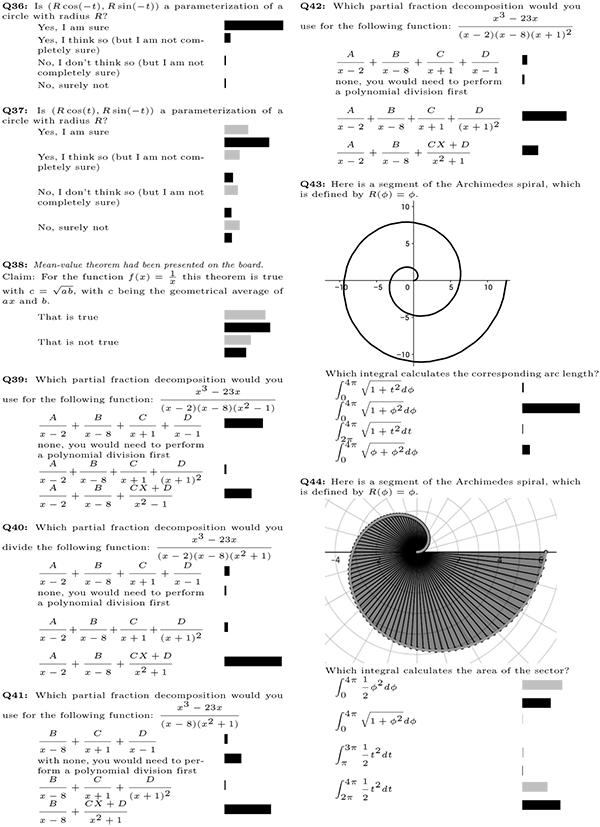
Figure 3: Clicker questions 36-44 (translated from German)(click to enlarge)
As math heavily builds up on what has been taught before, it is essential that the covered material is understood before moving on. It is thus unfortunate that clickers are less frequently used in math than for example in physics, since also here, they were found to improve student success rates in exams (Strasser, 2010; Simelane & Skhosana, 2012). Even for small classes, significant gains on exam scores could be found for low-performing students (Roth, 2012), while no significant effect could be found for higher-performing students. They were also found to be a meaningful reflection of student performance (Lucas, 2009) and to increase student engagement (Lucas, 2009). Another important aspect of using clickers, also in mathematics lectures, is identifying student difficulties (Cline, Parker, Zullo & Stewart, 2012). In this paper, we report on our experience using clickers for various kinds of questions in different instructional settings:
-
supplementing traditional lectures to provide feedback to learners and instructors,
-
as peer instruction questions, where, at the discretion of the instructor, learners initially gave personal answers, then discussed the questions with each other, and then voted again, and
-
in a flipped-classroom scenario, where readings were assigned ahead of class as homework, so rather than lecturing, more of the class time could be dedicated to discussions and problem solving.
In particular, we look at test-theoretical properties of the questions and correlations between them to identify which of these scenarios and question types are the most effective. Finally, we address concerns that a mixed bag of questions and scenarios might unduly taint overall test-theoretical results, i.e., we investigate the robustness of the approach to varying instructional scenarios. Overall, we were able to replicate many of the findings from physics lectures (Kortemeyer, 2016), with some additional observations which may inform instructors on how to most effectively use clickers.
The study took place in a first-year, introductory calculus course for civil engineering majors at ETH Zurich, which is offered every other semester and taught in German. These students have a fairly high level at mathematical knowledge and skills when they graduate from high school. The two-week segment of the course concerned with complex numbers was, as an experiment, taught in flipped-classroom style (Tucker, 2012; Bishop, Verleger, et al., 2013), where students had to prepare and review ahead of class, so more time in lecture could be spent on problem solving and practice (students were not especially prepared for this methodology, instead, the instructor simply introduced the logistics).
The course under consideration in this study was conducted in a face-to-face setting, however, the same practice was also used during the first COVID-19 semester, using Zoom (Zoom Video Communications, 2020) for synchronous remote instruction (Kortemeyer, 2020). Naturally, though, classroom response systems would not work with asynchronous remote instruction such as lecture recordings, as the interactive element is essential. While Zoom and similar software have built-in polling features, those do generally not allow for the same level of question complexity, and there are usually no analytics or export features.
Figures 1 through 3 show the questions used over the course of the semester, labelled Q1-Q44. If a question is labelled “multiple,” students were able to select more than one answer; otherwise, only one answer could be selected. The bars correspond to the percentage of students who selected the particular answer; gray bars indicate that the instructor invoked the “interim results” function discussed later. For multiple choice questions (where one student can vote for more than one choice), the bars indicate the percentage of the total number of votes. The subset of questions Q5-Q33 were part of a sequence of questions used in the flipped-classroom experiment and used over a duration of two weeks. Including the “interim results.” where students answered the same question twice, a total of 57 clicker questions were posed.
A total of 239 students submitted anywhere from 1 to 53 clicker answers, with an average of 24 ± 14 submissions. While this response rate might seem low, particularly when compared to the United States, it needs to be seen in the context of completely voluntary lecture participation.
We used EduApp (Korner, Volk, Valkering-Sijsling & Reinhardt, 2013) as the clicker system, which is designed to improve interaction between students and instructors in the lecture hall, and to make daily academic life easier. Apart from being connected to the single sign-on mechanism, the app is standalone. It works on iOS and Android, both smartphones and tablets, and with limited functionality (including, however, the clicker functionality discussed here) as a web application.
The function “interim results” enables lecturers to display answer distributions along the way, but does not yet indicate the correct answer. The gray bars represent these “interim results,” while the black bars represent the final answers. Instructors most frequently use this feature for peer instruction (Mazur, 1997), where the goal is for students to teach each other. After students have discussed interim results with their neighbors, they have the opportunity to change their mind and answer a second time. When the instructor finally closes the question, both first and second answers are displayed with the correct answers marked.
Group formation for peer instruction depended on freely-chosen seating arrangements, and an argument could be made that the effectiveness of this pedagogy might suffer from homophily, where groups of academically high-achieving and low-achieving students might congregate. While academic aptitude appears to be a minor factor in group formation (Freeman, Theobald, Crowe & Wenderoth, 2017), mixing up the seating could be considered in future semesters.
Usage statistics show that EduApp is regularly actively used by about half of ETH Zurich’s student population (12,800 out of 22,200 students), i.e., as an active element of classroom instruction. This is not counting passive use of the same app for class schedules and campus maps. During the COVID-19 semester, some instructors reported increased usage of EduApp in order to keep in touch with their remote students, and the plan is to make EduApp the central feedback component for future remote courses, should the crisis continue. Unfortunately, though, peer instruction does not translate well into these remote settings; while in principle breakout groups are possible in tools like Zoom, splitting the class requires considerable logistics and time - these logistics are very worthwhile for extensive group discussions, but may not be justifiable for quick “turn to your (virtual) neighbor” discussions.
While we used EduApp in our ETH courses, the approach and results discussed here are transferable to most other clicker systems, including radio-frequency solutions (e.g. (Macmillan Learning, 2020)) and other clicker apps. Any of these systems support the pedagogical approach we chose, and learning analytics are possible with any system that supports the export of raw data. While particularly for commercial audience response systems, cloud solutions are available for the backend, many of the open systems allow for installation on local servers.
For each student and each vote, response data was downloaded anonymously. Interim and final answers were treated as separate questions and labelled QN.1 and QN.2, respectively. This is important when analyzing peer instruction, e.g., Q32.1 are the results before and Q32.2 the results after peer discussion. Following common practice, “questions” will frequently be referred to as “items” for the remainder this paper.
As test theories are applied to clicker data, both learner and item characteristics need to be considered. For the learner, some measure of ability is established: in Classical Test Theory (CTT) this is the overt total score, while in Item Response Theory (IRT), ability is considered a latent trait, which is not directly related to the score. Both theories have a parameter corresponding to the difficulty of an item, where generally the difficulty is higher the less learners get the item correct. Finally, both theories that we employed have a measure of discrimination. Generally, the discrimination of an item is high if learners with high ability tend to get it correct, while learners with low ability get it incorrect - in other words, the item distinguishes (“discriminates”) well between high- and low-ability students, and thus provides meaningful feedback. On the other hand, an item has low discrimination if getting it correct or not does not depend on ability. Theoretically, negative discrimination is possible if students with high ability tend to get the item incorrect, while low-ability students get it correct; such degenerate items demand special attention, and most likely, they are wrong.
CTT evaluates item characteristics such as mean and biserial coefficient: the mean essentially describes the fraction of students getting the item correct (the higher the mean, the lower the difficulty), while the biserial coefficient is a measure of how well the item distinguishes between students who generally do well, i.e., appear to have a good grasp of the material, and those who unfortunately do not. This biserial coefficient (“discrimination”) is essential to determine the meaningfulness of formative assessment; the higher the discrimination, the more likely the outcome truly reflects the level of understanding of the concepts and enables students and instructors to early on address difficulties. In CTT, a high- or low-ability student succeeding or failing on a particular item receives equal weight. Also, high- or low-discrimination items receive equal weight in student-ability levels; there is no feedback cycle between item parameters and student traits. Calculations were performed using the ctt package (Willse, 2014) within the R statistical software system (R Development Core Team, 2008).
IRT incorporates traits of the learners, most notably “ability,” which is different from the overt score. Item parameters and student traits feed back on each other in an iterative cycle. There is an ongoing discussion whether the deterministic CTT or the more free-flowing, Bayesian IRT are “better” (Burton, 2005; Morales, 2009), so in our study, both methods have been used.
Just like CTT, IRT was developed in traditional exam settings (see Lord and Novick (Lord & Novick, 1968)). IRT has also been used to examine the validity of concept tests (e.g., (Ding & Beichner, 2009; Cardamone et al., 2011)), exams (e.g., (Morris et al., 2006)), online homework (e.g., (Lee, Palazzo, Warnakulasooriya & Pritchard, 2008; Kortemeyer, 2014)), and clicker questions (Kortemeyer, 2016). The most simple IRT model assumes that students have one trait, their ability, and that items have one so-called item-parameter, namely their “difficulty” (Rasch, 1993). We are using a slightly more advanced model, the two-parameter logistic (2PL) model (Birnbaum, 1968), which incorporates the equivalent of the CTT discrimination. The 2PL-model assumes that based on a learner j’s ability θj , the probability for this learner j correctly answering problem i can be modeled as pij = pi (θj) = 1/(1+exp(ai (bi −θj ))). Here, θj models the ability of learner j, bi the difficulty of item i (corresponding to the mean in CTT), and ai the discrimination of item i (corresponding to the biserial coefficient in CTT). Estimating the item parameters ai and bi , as well as the student ability θj is a multidimensional optimization problem; calculations were performed using the Latent Trait Model (ltm) package (Rizopoulos, 2006) within the R statistical software system (R Development Core Team, 2008). A “quick-and-dirty” guide on how to perform these analyses can be found in Kortemeyer (2019).
There are also 3PL models, which incorporate guessing (Birnbaum, 1968), as well as models with more than one “ability” (Reckase, 1997). However, these additional parameters and traits add complexity without necessarily gaining much more information (Kortemeyer, 2014; Gönülateş & Kortemeyer, 2015).
In addition to metrics on the individual items, the relationship between the items are of interest: how ist performance on the items correlated with each other? To that end, the correlation between the items can be calculated using the cor()-function in R (R Development Core Team, 2008), resulting in a correlation matrix that can be visualized in various ways. In our study, we chose a Fruchterman-Reingold (Fruchterman & Reingold, 1991) graph with the items as vertices and the correlation between the items as edges (using the qgraph-package (Epskamp, Cramer, Waldorp, Schmittmann & Borsboom, 2012)). The closer together two questions are, the more likely that any one particular student would either solve both of them correctly or incorrectly, which indicates that there is at least one common, potentially latent, concept necessary to solve both.
|
CTT |
IRT |
CTT |
IRT |
||||||
|
Item |
Mean |
Bis |
Diff |
Disc |
Item |
Mean |
Bis |
Diff |
Disc |
|
Q1 |
0.42 |
0.28 |
0.78 |
0.42 |
Q22.1 |
0.15 |
0.62 |
1.48 |
1.56 |
|
Q2 |
0.39 |
0.28 |
1.07 |
0.41 |
Q22.2 |
0.35 |
0.73 |
0.52 |
1.76 |
|
Q3 |
0.47 |
0.37 |
0.19 |
0.52 |
Q23 |
0.02 |
0.51 |
3.32 |
1.41 |
|
Q4.1 |
0.36 |
0.53 |
0.78 |
0.85 |
Q24 |
0.13 |
0.77 |
1.42 |
2.23 |
|
Q4.2 |
0.36 |
0.55 |
0.72 |
0.91 |
Q25 |
0.13 |
0.76 |
1.45 |
2.11 |
|
Q5 |
0.5 |
0.58 |
0 |
1.15 |
Q26 |
0.13 |
0.47 |
2.27 |
0.94 |
|
Q6 |
0.42 |
0.58 |
0.32 |
1.27 |
Q27 |
0.38 |
0.61 |
0.5 |
1.19 |
|
Q7 |
0.41 |
0.5 |
0.38 |
1.07 |
Q28 |
0.54 |
0.66 |
-0.18 |
1.44 |
|
Q8 |
0.44 |
0.55 |
0.23 |
1.13 |
Q29 |
0.38 |
0.62 |
0.48 |
1.2 |
|
Q9.1 |
0.33 |
0.69 |
0.58 |
1.77 |
Q30 |
0.38 |
0.49 |
0.66 |
0.8 |
|
Q9.2 |
0.54 |
0.67 |
-0.15 |
1.55 |
Q31.1 |
0.19 |
0.42 |
2.19 |
0.71 |
|
Q10.1 |
0.22 |
0.55 |
1.45 |
1.05 |
Q31.2 |
0.4 |
0.5 |
0.56 |
0.81 |
|
Q10.2 |
0.5 |
0.6 |
-0.02 |
1.26 |
Q32.1 |
0.09 |
0.21 |
5.6 |
0.42 |
|
Q11.1 |
0.26 |
0.61 |
0.94 |
1.54 |
Q32.2 |
0.33 |
0.59 |
0.74 |
1.18 |
|
Q11.2 |
0.38 |
0.69 |
0.43 |
1.73 |
Q33 |
0.46 |
0.66 |
0.12 |
1.47 |
|
Q12.1 |
0.1 |
0.67 |
1.7 |
1.9 |
Q34 |
0.29 |
0.42 |
1.38 |
0.71 |
|
Q12.2 |
0.39 |
0.78 |
0.33 |
2.8 |
Q35 |
0.43 |
0.55 |
0.34 |
0.9 |
|
Q13 |
0.46 |
0.77 |
0.13 |
3.17 |
Q36 |
0.38 |
0.64 |
0.53 |
1.15 |
|
Q14 |
0.51 |
0.77 |
0 |
2.92 |
Q37.1 |
0.16 |
0.47 |
2.16 |
0.85 |
|
Q15 |
0.13 |
0.44 |
2.28 |
0.93 |
Q37.2 |
0.36 |
0.6 |
0.63 |
1.14 |
|
Q16 |
0.47 |
0.77 |
0.09 |
2.93 |
Q38.1 |
0.23 |
0.42 |
1.91 |
0.67 |
|
Q17 |
0.47 |
0.82 |
0.09 |
3.81 |
Q38.2 |
0.3 |
0.53 |
1.05 |
0.92 |
|
Q18.1 |
0.32 |
0.65 |
0.57 |
2.21 |
Q39 |
0.18 |
0.59 |
1.46 |
1.29 |
|
Q18.2 |
0.33 |
0.66 |
0.54 |
2.24 |
Q40 |
0.29 |
0.67 |
0.81 |
1.53 |
|
Q19.1 |
0.38 |
0.69 |
0.35 |
2.44 |
Q41 |
0.07 |
0.56 |
2.28 |
1.44 |
|
Q19.2 |
0.41 |
0.7 |
0.29 |
2.53 |
Q42 |
0.27 |
0.55 |
1.1 |
1.11 |
|
Q20 |
0.36 |
0.56 |
0.62 |
1.12 |
Q43 |
0.03 |
0.35 |
3.94 |
0.95 |
|
Q21 |
0.31 |
0.48 |
0.96 |
0.94 |
Q44.1 |
0.16 |
0.5 |
1.96 |
0.96 |
|
Q44.2 |
0.3 |
0.41 |
1.44 |
0.64 |
|||||
Table 1: CTT and IRT parameters of the items
Table 1 shows the item parameters, using both CTT and IRT. Overall, these statistics are closely related: CTT and IRT difficulties and discriminations are both correlated with R2 = 0.74. Fig. 4 shows pi(θ) for each item; these curves are called “Item Characteristic Curves” and allow for a quick evaluation of IRT-results, particularly with respect to “outliers.” Fig. 5 shows a force-directed graph of the correlation data using the Fruchterman-Reingold algorithm (Fruchterman & Reingold, 1991; Epskamp et al., 2012). These graphs allow to visualize neighborhoods of questions; the closer the vertices and the thicker the edges, the stronger the correlation between the items.
In spite of the non-exam setting, the clicker questions exhibit an acceptable difficulty-distribution and remarkably high discrimination - the questions are meaningful to both students and the instructor.
Questions Q9-Q12, Q22, Q31-Q32, Q37-Q38, and Q44 were opened up to peer discussion (EduApp’s “interim results” function was used). It is remarkable that in all these cases, after the discussion, not surprisingly the difficulty of the items went down, but surprisingly and encourgagely their discrimination went up. In other words, following peer instruction, the items even better distinguished between students having a good grasp of the material and those who do not.
Q31 and Q32, which test conceptional understanding of solutions of complex polynomials, illustrate this. These are hard questions, as students need to apply conceptual knowledge of what it means when the coefficients are real, as well as how to take a root of a complex number and the associated geometry. After peer instructions the questions made a clear jump towards “easier” and their discrimination slightly increased. Increased discrimination means that after peer discussion, correctness of the question is truer reflection of the learners’ ability; apparently, peer discussion allows students to live up to their ability, even if they got questions wrong the first time around.
In Fig. 5 it becomes apparent that to some degree for Q31 (upper left corner), but extremely so for Q32 (extreme left), the vote after peer instruction moves closer to the central cluster. One can surmise that the discussion reduced hurdles or misunderstandings which may have kept good students from getting the item correct, and thus more strongly brought forward their deeper, conceptual understanding.
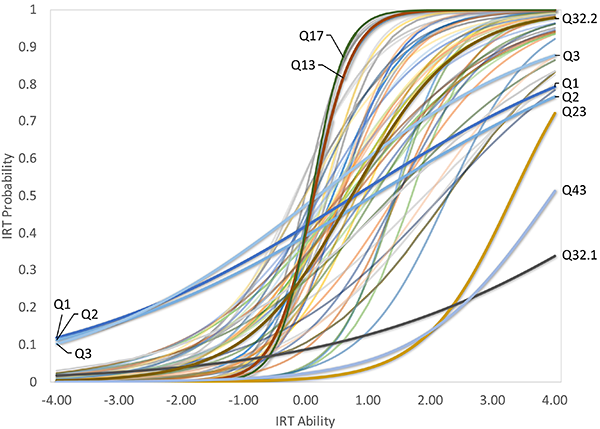
Figure 4: Item Characteristic Curves for the parameters shown in Tab. 1. The higher the difficulty bi
, the further the inflection point is located to the right. The higher the discrimination ai
, the steeper the curve at the inflection point. Ideal are centered inverted-S curves with steep slopes; some of the “outliers” have been labelled.(click to enlarge)
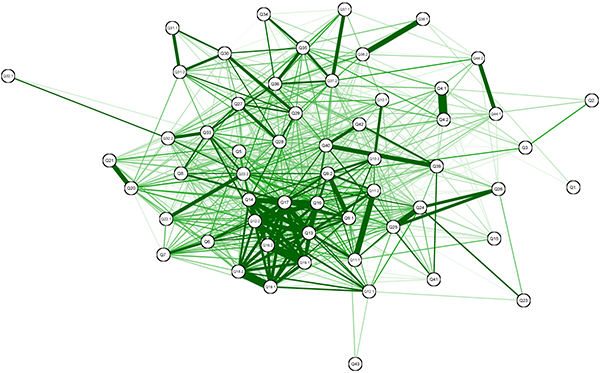
Figure 5: Fruchterman-Reingold representation of the correlation matrix. The graph shows for which questions the answer patterns are closely related to each other.(click to enlarge)
Also in question Q12, the discrimination strongly increased after peer instruction, because getting it wrong could be due to simply misremembering the definition. Peer instruction can clear this up quickly, and then those high-ability students who actually understood the concept but misremembered the definition will also get it right.
A selection of questions allowed for multiple answers (marked “multiple”), namely Q6, Q16, and Q17. The small sample size does not allow for generalizable statements, but it appears that Q16 and Q17 have a relatively high discrimination (with Q17 having the highest IRT-discrimination of all items), while at the same time only being moderately difficult. One reason for the higher discrimination may simply be a reduced chance of getting the item correct by random guessing; the chance of getting an n-answer single-choice question correct by randomly guessing is 1/n, while it is 1/2n for a multiple-choice question.
However, Q17 also has the interesting property that all answers are correct. It takes conviction to check all boxes on a multiple choice problem, and apparently only the truly strong students felt confident enough to do so (of course, tricks like that would wear out over the course of a semester). Combined with the property that students either do or do not know what the argument of a complex number is, this leads to extremely high discrimination.
Q23 presents an interesting case study: the answer choices are almost equally distributed, which usually suggests randomness and general student confusion. It is also apparently one of the most difficult items, which might be due to the fact that the question was given in the context of polar coordinates, but the answers try to direct the student in a different direction: the student should calculate (1 + i)2 = 2i and then use power laws to get the right answer (2i)1000 = 21000. As this required “out of the box” thinking, and students easily fall into traps related to using power laws, this was a difficult question. The question still preserves moderate discrimination: the students who got it correct did so for a reason.
This is surprising, since the preceding item Q22 is essentially the same question. Just like all other items with peer instruction, Q22 benefited from the discussion and became “easier,” so students should have been ready for Q23. The most likely explanation is that in Q22 (as opposed to Q23), answers are actually given in polar coordinates, which direct the learner to the standard methods of calculating powers of complex numbers. This shows that the presentation of the answers can play a crucial role in the expected outcome. Another possible explanation is the power 7 versus 2000. It may be that students perceive 7 as a “normal” number and simply do the calculation; 2000 is an even number, and students may expect that something “special” should happen here (being used to “special” things happening with 2, but not with 7); lower-ability students may have picked a random “special”-looking answer without calculating.
Questions Q6, Q7, Q36, and Q37 contained statements such as “don’t know” and “not completely sure,” which invite students to express the desire for further discussion or peer instruction. It turns out, though, that these particular questions were easy (as indicated by the low difficulty and the low number of students choosing “not sure”), except for Q37: for this item, many students chose “not sure”-type answers, but the subsequent peer instruction greatly improved the item characteristics.
The most noticeable feature of Fig. 5 is the cluster formed by questions Q13 to Q19 (lower middle), with the exception of Q15 (lower right, essentially unconnected). One can surmise that this is due to an added complication unconnected to complex numbers, namely learners had to know the value of trigonometric functions for 2π/3; this may be the reason that Q15 is a “bad” problem from a test-theoretical standpoint, as it has high difficulty and low discrimination.
|
Ave. CTT Mean |
Ave. CTT Bis |
Ave. IRT Diff |
Ave. IRT Disc |
|
|
Q1-Q4, Q34-Q44 |
0.29 ± 0.12 |
0.49 ± 0.11 |
1.29 ± 0.88 |
0.91 ± 0.32 |
|
Q5-Q33 |
0.34 ± 0.14 |
0.62 ± 0.12 |
0.87 ± 1.11 |
1.65 ± 0.77 |
Table 2: Average CTT and IRT Parameters and Standard Deviations for the Items in the Traditional (top row) and Flipped Scenarios (bottom row).
A similar example is the strong connection of questions Q39, Q40, and Q42, while question Q41 is disconnected and has a much higher difficulty. While all of them deal with the partial decomposition of functions, Q41 is rather different from the other ones related to this topic. This is an example on how to use “traps” in order to get a point across. Students had been given an algorithm for the partial fraction integration method. Step 0 was to perform polynomial division if needed. The instructor anticipated that the students usually concentrate on the other steps and tend to forget this Step 0. With the sequence Q39-Q42 the instructor could make the learners concentrate on the later parts of the algorithm and then install a “trap” with Q41. The item parameters show that many students fell into this “trap,” which will hopefully make them remember the importance of Step 0 in the future.
A common concern is that the instructional setting is influencing item parameters, and it is certainly true that the same item may show different characteristics in different contexts. In our study, items Q5-Q33 were taught in a flipped classroom modality, while items Q1-Q4 and Q34-Q44 were embedded into traditional lectures. Table 2 shows the average item parameters for both subsets of items. Notably, the average discrimination of the items deployed in the flipped classroom setting is higher than in the traditional scenario, suggesting that clickers may be even more meaningful there.
Since both the CTT biserial coefficient and the IRT parameters take into account all items in a pool, it is also of concern if items administered in different (particularly non-suitable) instructional settings may contaminate the calculated values for other subsets of items. We recalculated all CTT and IRT parameters for just the reduced dataset of flipped-classroom items and compared the results to the full dataset. The correlation between CTT biserial coefficients for both datasets was R2 = 0.96, the correlations between the IRT difficulties and discriminations were R2 = 0.996 and R2 = 0.99, respectively; thus, in our case study, both CTT and IRT proved to be robust and safe to use globally in mixed scenarios.
Not much effort is involved in coming up with items, and instructors should feel free to just pose them based on for example previous lecture examples. However, we strongly recommend to make notes of clicker outcomes during the lecture and work them out in details afterwards, so that changes can be made the next time this material is taught to a similar group. Instructors benefit from knowing better where they need to invest more time as understanding is hard to achieve and where they may speed up as the concept may be easier than they had anticipated. Based on classroom experience and our question analysis, we draw the following conclusions for effective clicker usage:
Mixing of concepts is not good practice in items, as it adds complexity unrelated to the concept at hand (evidenced by for example Q15). Clicker problems are best at the Bloom levels of remembering or understanding concepts (Bloom, 1956), while higher levels such as applying the concepts in new situations are best conveyed by homework.
Instructors found it helpful to start the lecture with a question from the homework which stood out for its difficulty. This question can already be projected when the students are entering the lecture hall; it gives them something to do, it refreshes the knowledge from last week, and so one more easily gets the students to the point where the instructor wants to start with the current week’s material.
Clickers appear to be particularly effective in flipped classrooms, where students come into the classroom prepared and already with a basic grasp of the material. In standard lectures one hopes to teach by lecturing, while in flipped classrooms, one tries to design series of items which gradually make students understand certain, small ideas, and the learning process takes place in answering questions.
It is effective to tell “mini stories,” such as Q39-Q42, and intentionally lay traps to bring home particular messages; since we are dealing with ungraded, formative assessment (as opposed to exams), these traps do not hurt students’ grades.
Some instructors prefer to decide on having a peer discussion “on the spot” if “interim results” are puzzling or provocative (Kortemeyer, 2016), however, with some experience the instructor can device questions in which many students will initially fail, but where peer instruction and class discussion can explain the difficulty. We believe that learning from mistakes and explaining them to someone else produces better understanding.
Some instructors report that clickers are a nice way to “break up” long lecture periods. At our institution, lectures are twice 45 minutes with a short break, and clickers are a welcome means to set accents and wake up the occasional student or two.
We will incorporate test-theoretical algorithms into EduApp so instructors can gauge the effectiveness and quality of their clicker questions. As CTT and IRT are delivering comparable results, but CTT is easier to implement and can easily be calculated on-the-fly, we plan on implementing CTT.
Due to the ongoing COVID-situation, it has not been possible yet to repeat this study. However, based on this experience, the use of peer instruction will likely be expanded in future.
Clickers have shown promise to be a practical and relatively low-threshold tool to improve math instruction. There are a number of solutions available, both using dedicated radio-frequency devices or - as in our case - apps that run on students’ smartphones or tablet computers. The approach can be used in face-to-face instruction or in synchronous remote settings.
Questions can naturally grow out of the lecture materials. Test-theoretical properties of these questions show that they generally provide meaningful formative assessment for students and feedback to the instructor. We found them to be particularly effective in connection with peer instruction, as asking the same item again after peer discussion not only led to lower difficulty, but also to higher discrimination; peer instruction “sharpens” the feedback from clicker results (as opposed to for example students simply voting for the most popular answer of the first round or submitting guesses) - the increased discrimination after peer instruction is probably the most surprising and most encouraging result of this study.
Posing clicker questions gives instructors a much deeper understanding of the actual population, and the lecture will be based on real experience and not on theoretical ideas or their own experience with the subject, which may have been blurred. In the long run, lectures will improve as this real-life experience will flow into next year’s course, which will hence better meet the students’ needs.
The authors wish to thank Werner Schnedl and Roman Brugisser for their help with exporting data from EduApp.
Barth-Cohen, L. A.; Smith, M. K.; Capps, D. K.; Lewin, J. D.; Shemwell, J. T.; Stetzer, M. R.: What are middle school students talking about during clicker questions? Characterizing small-group conversations mediated by classroom response systems. In: Journal of Science Education and Technology , 2015, 25, pp. 50–61. https://link.springer.com/article/10.1007/s10956-015-9576-2 (last check 2020-11-03)
Beatty, I.; Gerace, W.: Technology-enhanced formative assessment: A research-based pedagogy for teaching science with classroom response technology. Journal of Science Education and Technology, 2009, 18 (2), pp. 146-162. Retrieved from doi: 10.1007/s10956-008-9140-4 (last check 2020-11-03)
Birnbaum, A.: Statistical theories of mental test scores. In: Lord, F. M.; Novick, M. R. (Eds.): Statistical theories of mental test scores, Addison-Wesley, Reading, Mass., 1968, pp. 374-472.
Bishop, J. L., Verleger, M. A., et al.: The flipped classroom: A survey of the research. In: ASEE national conference proceedings, Atlanta, GA, 2013, 30, pp. 1–18.
Bloom, B. S.: Taxonomy of educational objectives handbook. Bd. 1: The cognitive domain. David McKay Co Inc., New York, 1956.
Burton, R. F.: Multiple-choice and true/false tests: myths and misapprehensions. In: Assessment & Evaluation in Higher Education, 2005, 30 (1), pp. 65–72.
Cardamone, C. N.; Abbott, J. E.; Rayyan, S.; Seaton, D. T.; Pawl, A.; Pritchard, D. E.: (2011). Item response theory analysis of the mechanics baseline test. In: Rebello, N. Sanjay; Engelhardt, Paula V.; Singh, Chandralekha: Physics education research conference 2011 aip conference proceedings, 2011, pp. 135-138.
Cline, K.; Parker, M.; Zullo, H.; Stewart, A.: Addressing common student errors with classroom voting in multivariable calculus. In: PRIMUS, 2012, 23 (1), pp. 60–75.
Crouch, C. H.; Mazur, E.: Peer instruction: Ten years of experience and results. In: American Journal of Physics, 2001, 69 (9), pp. 970–977.
Ding, L.; Beichner, R.: Approaches to data analysis of multiple-choice questions. In: Phys. Rev. ST Phys. Educ. Res., 5, 2009, 020103. Retrieved from doi: 10.1103/PhysRevST- PER.5.020103 (last check 2020-11-03)
Epskamp, S.; Cramer, A. O. J.; Waldorp, L. J.; Schmittmann, V. D.; Borsboom, D.: qgraph: Network visualizations of relationships in psychometric data. In: Journal of Statistical Software, 2012, 48 (4), pp. 1–18. Retrieved from http://www.jstatsoft.org/v48/i04/ (last check 2020-11-03)
Fagen, A. P.; Crouch, C. H.; Mazur, E.: Peer instruction: Results from a range of classrooms. In: The Physics Teacher, 2002, 40 (4), pp. 206–209.
Freeman, S.; Theobald, R.; Crowe, A. J.; Wenderoth, M. P.: Likes attract: Students self-sort in a classroom by gender, demography, and academic characteristics. In: Active Learning in Higher Education, 2017,18 (2), pp. 115–126.
Fruchterman, T. M.; Reingold, E. M.: Graph drawing by force-directed placement. In: Software: Practice and experience, 1991, 21 (11), pp. 1129–1164.
Gönülateş, E.; Kortemeyer, G.: A new item response theory model for open-ended online homework with multiple allowed attempts. In: Phys. Rev. ST Phys. Educ. Res., 2015 (submitted).
Keller, C.; Finkelstein, N.; Perkins, K.; Pollock, S.; Turpen, C.; Dubson, M.: Research-based practices for effective clicker use. In: 2007 physics education research conference, 2007, Vol. 951, pp. 128– 131.
Korner, T.; Volk, B.; Valkering-Sijsling, M.; Reinhardt, A.: ETH EduApp. Eine multifunktionale Mobilapplikation fu¨r die Hochschullehre an der ETH Zu¨rich. In: Bremer, C.; Kr¨omker, D. (Eds.): E-learning zwischen Vision und Alltag: zum Stand der Dinge. Waxmann Verlag, Münster, 2013.
Kortemeyer, G.: Extending item response theory to online homework. In: Phys. Rev. ST Phys. Educ. Res, 2014, May, 10, p. 010118. Retrieved from doi: 10.1103/PhysRevSTPER.10.010118 (last check 2020-11-04)
Kortemeyer, G.: The psychometric properties of classroom response system data: a case study. In: Journal of Science Education and Technology, 2016, 25, pp. 561–57. https://link.springer.com/article/10.1007/s10956-016-9613-9 (last check 2020-11-05)
Kortemeyer, G.: Quick-and-dirty item response theory. In: The Physics Teacher, 2019, 57 (9), pp. 608–610. https://doi.org/10.1119/1.5135788 (last check 2020-11-04)
Kortemeyer, G.: That’s one giant step for a university, one small leap for digitization. Bulletin VSH-AEU, 2020, 43 (3/4), pp. 33–38. http://vsh-aeu.ch/download/284/VSH_Bulletin_November_2020_WEB.pdf (last check 2020-11-06)
Lasry, N.; Mazur, E.; Watkins, J.: Peer instruction: From harvard to the two-year college. In: American Journal of Physics, 2008, 76 (11), pp. 1066–1069. DOI 10.1119/1.2978182 (last check 2020-11-05)
Lee, Y.-J.; Palazzo, D. J.; Warnakulasooriya, R.; Pritchard, D. E.: Measuring student learning with item response theory. In: Phys. Rev. ST Phys. Educ. Res. 4, 2008, Jan, 010102. Retrieved from doi: 10.1103/Phys- RevSTPER.4.010102 (last check 2020-11-05)
Lord, F. M.; Novick, M. R. (Eds.): Statistical theories of mental test scores. Addison-Wesley, Reading, Mass, 1968.
Lucas, A.: Using peer instruction and i-clickers to enhance student participation in calculus. In: Primus, 2009, 19 (3), pp. 219–231.
Macmillan Learning. iClicker classroom response system. https://www.iclicker.com/ . (last check 2020-11-05)
Mazur, E.: Peer instruction. Prentice Hall, Upper Saddle River, NJ, 1997.
Morales, R. A.: Evaluation of mathematics achievement test: A comparison between CTT and IRT. In: The International Journal of Educational and Psychological Assessment, 2009, 1 (1), pp. 19–26.
Morris, G. A.; Branum-Martin, L.; Harshman, N.; Baker, S. D.; Mazur, E.; Dutta, S., Taha Mzoughi, T.; McCauley, V.: Testing the test: Item response curves and test quality. In: American Journal of Physics, 2006, 74 (5), pp. 449–453. DOI 10.1119/1.2174053 (last check 2020-11-05)
R Development Core Team: R: A language and environment for statistical computing. [Computer software manual] R Foundation for Statistical Computing, Vienna, 2010 (ISBN 10: 3900051070 ISBN 13: 9783900051075) Retrieved from http://www.R-project.org
Rasch, G.: Probabilistic models for some intelligence and attainment tests. ERIC, University of Chicago Press, Chicago, 1993.
Reckase, M. D.: The past and future of multidimensional item response theory. In: Applied Psychological Measurement, 1997, 21 (1), pp. 25–36. DOI https://doi.org/10.1177/0146621697211002 (last check 2020-11-05)
Richardson, A. M.; Dunn, P. K.; McDonald, C.; Oprescu, F.: Crisp: An instrument for assessing student perceptions of classroom response systems. In: Journal of Science Education and Technology , 2015, 24, pp. 432–447. DOI https://doi.org/10.1007/s10956-014-9528-2 (last check 2020-11-05)
Rizopoulos, D.: ltm: An R package for latent variable modelling and item response theory analyses. In: Journal of Statistical Software, 2006, 17 (5), pp. 1–25. Retrieved from http://www.jstatsoft.org/v17/i05/ (last check 2020-11-05)
Roth, K. A.: Assessing clicker examples versus board examples in calculus. In: Primus, 2012, 22 (5), pp. 353–364. DOI https://doi.org/10.1080/10511970.2011.623503 (last check 2020-11-05)
Simelane, S.; Skhosana, P. M.: Impact of clicker technology in a mathematics course. In: Knowledge Management & E-Learning: An International Journal, 2012, 4 (3), pp. 279–292. https://www.kmel-journal.org/ojs/index.php/online-publication/article/view/171 (last check 2020-11-05)
Strasser, N.: Who wants to pass math? using clickers in calculus. In: Journal of College Teaching & Learning, 2010, 7 (3). https://doi.org/10.19030/tlc.v7i3.102 (last check 2020-11-05)
Tucker, B.: The flipped classroom - Online instruction at home frees class time for learning. In: Education next, 2012, 12 (1), pp. 82–83. https://www.educationnext.org/the-flipped-classroom/ (last check 2020-11-05)
Turpen, C.; Finkelstein, N. D.: Not all interactive engagement is the same: Variations in physics professors’ implementation of peer instruction. In: Physical Review Special Topics-Physics Education Research, 2009, 5 (2), 020101. DOI https://doi.org/10.1103/PhysRevSTPER.5.020101 (last check 2020-11-05)
Willse, J. T.: ct.: An R package for classical test theory functions. 2018. https://cran.r-project.org/web/packages/CTT/CTT.pdf (last check 2020-11-06)
Zoom Video Communications. Zoom video conferencing system. https://zoom.us/ . 2020. (last check 2020-11-05)