eLearning in the USA: The Standard? The Benchmark?
urn:nbn:de:0009-5-6886
Abstract
More than 3 million enrolments in online courses in the USA are reported by American sources. The essay investigates the role of online studies within the American educational system and tries to find out more about the exact meaning of these extremely high figures. The research discovers astonishing facts and relations: Public schools offer more online courses (82%) than private schools, and 52% of all online courses are offered by 2-year colleges for the associate degrees (and only 8% for the bachelor). A majority of online courses fulfill the role as "remedial courses" that serve for "credit recovery" (U.S. department of Education).
The quality of these courses is not very high. This applies to the use of media as well as to the didactic concept. The teaching staff mainly consists of hired part-time lecturers who are still at the very entrance level to an academic career.
The essay wants to initiate a discussion about the question if the European study system is in danger to imitate the shortcomings and consequences of the American educational system, because the European system is approximating the American due to recent political decisions. Can we still pursue the aims that we proclaimed when starting with eLearning, if in future eLearning will have to be used to repair the consequences of the bachelor?
Keywords: e-learning; multimedia; higher education, United States of America
Zusammenfassung
Amerikanische Quellen berichten von über 3 Millionen Studierenden in den USA, die in eLearning-Kursen eingeschrieben sind. Der Aufsatz fragt nach der Funktion der Online-Angebote im amerikanischen Bildungssystem und versucht, durch detaillierte Analyse offizieller Statistiken des amerikanischen Bildungsministeriums der genauen Bedeutung dieser enorm hohen Zahlen auf die Spur zu kommen. Die Recherche bringt erstaunliche Fakten zutage: So sind es überwiegend die staatlichen Hochschulen (82,9%) und vor allem die 2-year Colleges oder Community Colleges (52%), die eLearning-Kurse anbieten. 60% Prozent der Einschreibungen in Online-Kurse werden für Undergraduates angeboten, dabei gilt die Mehrheit den Associate Degrees (52%) und nur 8% gelten dem Bachelor. Die Kurse sind zu einem großen Teil Brückenkurse für Erstsemester ("remedial courses") oder sie dienen der Nachhilfe für berufstätige Studierende oder Studierende, die Lücken im Studium haben ("credit recovery").
Die Qualität der Kurse erweist sich bei genauerem Hinsehen als nicht vorbildlich. Dies betrifft sowohl den Medieneinsatz als auch die didaktische Konzeption. Auch zeigt sich, dass das in eLearning-Kursen eingesetzte Lehrpersonal überwiegend aus freien Lehrbeauftragten besteht, von denen viele ein geringes akademisches Qualifikationsniveau aufweisen.
Der Aufsatz will eine Diskussion darüber anstoßen, ob sich das europäische Hochschulsystem durch die in den letzten Jahren getroffenen Weichenstellungen der Hochschulpolitik nicht in bedrohlicher Weise dem amerikanischen System nähert und zwangsläufig dann auch mit den Folgen des amerikanischen Systems zu tun haben wird. Können wir es uns in Zukunft noch leisten, eLearning zur Bereicherung des Studiums einzusetzen, wenn es denn zur Reparatur der Folgen des Bachelor genutzt werden muss?
Stichwörter: e-learning; multimedia; higher education, United States of America
American Numbers Game
In 2002 Byron C. Anderson googled the term 'Distance Education Degree' and was amazed when his search resulted in 1,100,000 links. I repeated this search: On October 22nd, 2006 Google offered me 39,700,000 links, and today, August 1st, 2006 the number has reached 82,400,000. Although not all references refer to online degrees and many references occur more than once and a large part of the results were due to the improved algorithms of the search engine, this growth is nevertheless astonishing.
The National Center for Education Statistics (NCES), a department of the U.S. Department of Education, is a rich source of data on the American college system, the courses it offers, distance education and the students of America. NCES reported in the Statistical Analysis Report February 2002 "Distance Education Instruction by Postsecondary Faculty and Staff" (Ellen M. Bradburn, NCES 2000-155)(43) that the USA had an impressive 16.5 million students, of which 3.3 million enrolled in at least one online course, that 5.9 % of courses were being offered as online courses (Distance Education, DE) and that 6% of the teaching staff at colleges offered at least one DE course. This would indeed not only be a significant number of students in eLearning and of online courses but also of dedicated teachers.
In the NCES Report "Distance Education at Degree-Granting Postsecondary Institutions" (2003-017) Tiffany Waits and Laurie Lewis estimate that the number of "credit-granting" distance learning courses offered at various college levels is 118,000. However 76% of these courses are designed for undergraduates. They estimate that 2,876,000 students enrolled in online courses, 82% of which are undergraduates (I will explain the meaning of 'undergraduate' in this context at a later point). Hans Weiler (2005)(55) who was previously a professor at Stanford University and co-founded the Viadrina University is also of the opinion that "the U.S. Distance Learning market has expanded rapidly in the last few years". Although he advises caution "the figures should be handled with care", he is, nonetheless, clearly impressed by their magnitude:
"But the dimensions and growth rates are striking: from 1997-98 to 2000-01 the number of students taking DE courses more than doubled to 2.8 million; almost all public colleges (97 %) now offer at least part of their courses online; in 2004 approximately 3 million students availed of some part of this service, 600,000 for their complete course of study".
In their report "Entering the Mainstream: The quality and Extent of Online Education in the United States, 2003 and 2004", carried out for the Alfred P. Sloan Foundation, Elaine Allen and Jeff Seaman reported that 1,602,970 students took at least one online course in 2002 and 1,971,397 in 2003. The National Center for Education Statistics (NCES) which is part of the Department of Education has published projections which forecast a tremendous increase of up to 20% in the number of students by the year 2013. This figure is sure to frighten many European education policy-makers involved in tertiary education.
How can NCES assume that the 16.5 million students in the USA are responsible for 3.3 million "enrollments in online courses"-which represents about 20% of all students-when the Chancellor's Office of California Community Colleges (CCC 2001)(10) assumes that in 1995 only 0.65% and in 2001 only 1.2% of courses were online courses?
I would like to discover what exactly is hidden behind these and similar figures. In the following I will decode these figures like a detective would, to make it easier for the reader to understand them. For this purpose I will make use of official data supplied by the following institutions:
-
U.S. Department of Education: National Center for Education Statistics (NCES); [ http://nces.ed.gov/ ]
-
National Postsecondary Education Cooperative (NPEC); angesiedelt bei NCES; [ http://nces.ed.gov/npec/ ]
-
U.S. Department of Commerce: Economics and Statistics Administration: U.S. Census Bureau; [ http://www.census.gov/ ]
-
U.S. General Accounting Office (GAO); neuerlich: U.S. General Accountability Office [ http://www.gao.gov/index.html ]
-
National Education Association (NEA); [ http://www.nea.org/index.html ]
-
Council for Higher Education Accreditation (CHEA); [ http://www.chea.org/ ]
-
American Council on Education (ACE); [ http://www.acenet.edu/ ]
-
American Distance Education Consortium (ADEC); [ http://www.adec.edu/ ]
-
Chancellor's Office der California Community Colleges (CCC); [ http://www.cccco.edu/ ]
-
Sloan Consortium (Sloan-C); [ http://www.sloan-c.org/ ]
Why is it so important to closely examine these statistics? They tell us something about the status and role of eLearning in the US education system. Due to the fact that essential elements of the American system are being imported to Europe the statistics can perhaps tell us something about future defects and ramifications of the European bachelor system. The following circumstances are worth mentioning and should be considered when interpreting these significant figures.
Firstly it must be considered that the term "enrollment" does not represent an individual student but a course that has been booked. The statistics know two different types of enrollment: the enrollment at traditional on-campus universities [1] which is counted per person and the enrollment in an online course (3.3 million) which counts the number of courses booked by a person. Thus students in a brick and mortaruniversity are counted only once, whereas the students who enroll for two or more courses are counted two or more times (CCC 2001)(10). This means we have to reduce the huge number of 3.3 million by at least half if we want to find the exact amount of individual students who book online courses although most students take only one DE course (CCC 2001b (11); Allen & Seaman 2003 (2)). That is why the statistics state "students that have booked at least one online course". The reasons for this study behaviour where students register at traditional on-campus universities and then take additional online courses will be dealt with later.
Such behaviour can indeed be explained by the fact that students primarily register at traditional on-campus universities (CCC 2001 (10); AFT 2003 (1)): "The promise of greatly increased access to new student populations expressed in the early DE literature has not materialized. In fact, the vast majority of students taking online DE classes are actually enrolled in traditional brick-and-mortar campuses" (Heterick & Twigg, p. 4)(19). This can also be seen in the large-scale evaluations of the University of Central Florida [ http://pegasus.cc.ucf.edu/~rite/impactevaluation.htm#Who ]: The majority (75%-80%) of their online students are registered at a brick-and-mortar campus. Robert Zemsky and William Massy 2004 (57) confirm this fact in a study of the University of Pennsylvania: "At the institutions participating in the study, more than 80 percent of their enrollments in 'online' courses came from students already on their campuses".
Thus many students are counted several times, when they register at an on-campus university and when they book an online course. The majority are primarily attendees of conventional colleges and not the new type of virtual student. According to the study carried out by Elaine Allen and Jeff Seaman (2003)(2) that assumed that 1.6 million students took at least one online course in 2002, only 30% of these courses were taken by students who were doing all their courses online. One third can thus be identified as distance students who book more than one course, and, are therefore responsible for more than a third of all enrollments. It is therefore necessary to halve the 3.3 million registrations or perhaps reduce them even further to discover the real number of students as Hittelmann (CCC 2001b)(11) says: "These percentages are likely to be lower since students tend to take only one distance education course". However, this differentiation alone does not suffice as an explanation for these differences. We have to look for further reasons.
Secondly 82% of enrollments are for online courses at undergraduate level and only 18% for courses at graduate level, whereby the 2-year public colleges carry the main burden of the undergraduate courses:
|
Undergraduate |
Graduate |
|
|
public 2-year |
1.435.000 |
- |
|
public 4-year |
566.000 |
322.000 |
|
private 4-year |
278.000 |
202.000 |
Table 1 - Courses taken according college type; NCES 2004
The differentiation between courses for undergraduates and courses for graduates still does not suffice to tell us what this distribution signifies. Therefore another argument has to be presented.
Thirdly it can be determined that most of these online courses are offered by 2-year colleges or community colleges [2] where a course generally lasts two years and not by institutions that offer 4-year bachelor courses. This suggests that the bulk of the courses offered for undergraduates are mainly courses for Associate Degrees which is in fact the task of these colleges namely to award Associate Degrees [3] and to act as a bridge to bachelor programs:
|
Number of Enrollments |
Number of Institutions |
Level of Participation |
|
|
public 2-year |
1.472.000 |
1.070 |
90% |
|
public 4-year |
945.000 |
620 |
89% |
|
private 4-year [4] |
589.000 |
1.800 |
40% |
Table 2 - Institutes with online enrollments; NCES 2004
Thus, more than half of all online students are attending 2-year colleges where they hope to get an Associate Degree (Allen & Seaman 2003)(2). What importance can be really placed on this information and who makes up the rest of the students is interesting and requires further differentiation.
Fourthly comparison shows that those studying for an Associates Degree make up the lions share in online education (50%) whereas those participating in Masters (21%) or PhD programs (16%) represent a smaller share. Bachelor programs, which in Germany spring to mind as the best candidates for online courses, represent only a very small share (8%): "The fewest online learners are in Baccalaureate (105,917 students), about an equal number in Masters and Doctoral/Research (272,096 and 209,512 respectively), and the largest number in Associates (653,600)" (Allen & Seaman 2003)(2).
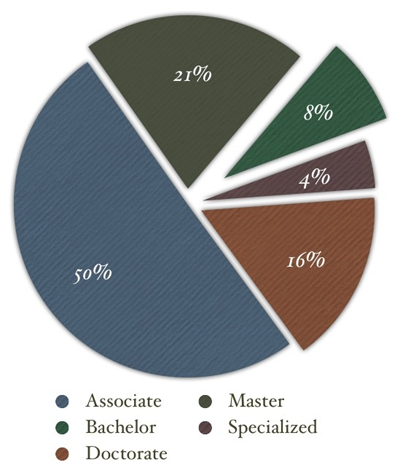
Figure 1 - Origin of Distance Learners based on level of study (Allen & Seaman 2003)(2)
When interpreting American statistics it has to be taken into consideration that, in all college statistics, 2-year state colleges [5] (Junior Colleges, Community Colleges) are also included, which offer the vast majority of online courses (Allen & Seaman 2004 (3); Wirt, Choy et al 2004 (56)). However, it seems that these 2-year colleges are a substitute for the missing final year of secondary education in the U.S. Indeed, as can be found in a judgment made by the Bund-Länder Kommission (2004), "The course content is largely at the same level as that in the final year of a secondary school". This affects the nature of online courses that are either bridge courses or General Education courses which I shall explain in greater detail in the next section.
Fifthly, 82.9% of the enrollments are from students at public colleges whilst just 200,000 enrollments are from students at private colleges (Allen & Seaman 2004)(3). It can be seen in the data of the NCES 2004 on institutions with online enrollment, that there are more 4-year private colleges than 2-year and 4-year public colleges together (without even counting the private 2-year institutions!), but which offer less than 20% of all online courses.
This relation opens the floodgates for a wide array of speculations. One of which will be discussed here: Can it be that public colleges reacted to pressure from competitors too late and now have to offer online courses as an additional attraction, whilst the private colleges wish to reserve the conventional model as an attractive USP for paying clients? If the interests of students are mainly directed towards studying at an on-campus university as Arthur Levine (2003, p.26)(23), President of the Teachers College of Columbia University, believes, then he could be right when he expresses his fear that this opportunity could, in the future, be reserved for the privileged few:
"My greatest fear is that in years to come this experience will be available only to the most affluent, best, and brightest in the nation. Others will be forced into cheaper click education."
This fear is not totally unfounded when one considers that 90% of public 2-year institutions and 89% of public 4-year institutions offer online courses but only 40% of the private universities (NCES 2004-077; Indicator 32; Distance Education at Postsecondary Institutions)(56) although these private colleges are, in terms of figures, more strongly represented. These private colleges may possibly be the only place able to offer students hereafter a real social atmosphere-in return for payment, of course. It has also been speculated that the private institutions allow the public institutions to take on the role of pioneer, which entails conducting the first costly experiments and, of course, making the required investments.
This assumption seems to contradict the observation that virtual "for-profit" universities are pushing themselves onto the market, an observation that led Greg Capelli (2003, p.50)(9) from Credit Suisse First Boston to assume that "it was only a matter of time before the private, for-profit enterprise leaders began to realize the inefficiencies in the system for higher education and began to offer a redefined product designed with the demands of contemporary students in mind". If these newly defined companies with their modern products really will be more successful or offer a new standard of quality can be doubted (Schulmeister 2001)(30). Arthur Levine (2003, p.20)(23) currently sees a stand-off between traditional and virtual universities whereby a solution cannot be forecast. "Either the for-profit sector will buy bricks before traditional colleges develop the capacity to operate in the click environment, or just the opposite may occur" [6]. Derek Bok (2003, p. 169)(6) explicitly warns against the commercialization of virtual education: "educators follow a treacherous course if they try to use the Internet for profit, especially when they join with venture capitalists to achieve their ends".
In addition to these differentiations it should be considered that the distribution of online students in the colleges and institutions is uneven. This is shown in an overview of 14 colleges, compiled by the U.S. General Accounting Office (GAO) 2004 (54), which contains the number of students and the percentage of which are online students, whereby the political reasons [7] for issuing this list are not of interest to me, but rather the data that cannot be found in any other American statistic:
|
College/University |
Students |
Online students in % |
Type of college/ University |
Founding Year |
|
Capella University |
3,985 |
100 |
Private for profit |
1993 |
|
Charter Oak State College |
1,496 |
100 |
Public |
1992 |
|
Eastern Oregon University |
4,908 |
69 |
Public |
1970 |
|
Southern Christian University |
1,029 |
93 |
Private nonprofit |
1993 |
|
U.S. Sports Academy |
704 |
100 |
Private nonprofit |
2001 |
|
Univ. of Maryland U. College |
29,442 |
77 |
Public |
1994 |
|
Walden University |
1,544 |
100 |
Private for profit |
1970 |
|
Western Governors' University |
242 |
100 |
Private nonprofit |
1999 |
|
Jones International University |
446 |
100 |
Private for profit |
1995 |
|
North Central University |
319 |
100 |
Private for profit |
1997 |
|
National Technical University |
969 |
100 |
Private nonprofit |
1984 |
|
University of Phoenix |
169,021 |
29 |
Private for profit |
1989 |
|
American Intercontinental U. |
5,885 |
54 |
Private for profit |
2001 |
|
St. Joseph's College |
5,063 |
56 |
Private nonprofit |
1974 |
Table 3 - Colleges/Universities and students (GAO 2004)(54)
This list gives food for thought [8]: GAO reported that 49,000 of the students at the University of Phoenix were distance students and 70% of the students at the State University of Maryland took at least one online course whereas all courses offered by the Western Governor's University and the Jones International University were online courses. If one can generalize this example, there is a large number of very small colleges which contribute little to the large figures and only a few colleges which lay the foundations for the large figures (Judith Eaton 2001 in her study for the Council for Higher Education Accreditation CHEA), whereby it has to be considered that the largest universities, namely the University of Phoenix Online and the University of Maryland really are special cases which cannot be compared to other universities [9]. It has been reported by the NCES that private colleges, most of which are still quite young, offer hardly any online courses (which is why private 4-year colleges are not contained in the statistics), whilst the public colleges, in particular the 2-year colleges, carry the main burden of development (see Table 3).
The Chancellors Office of California Community Colleges (CCC 2001)(10) presented its exciting but also very frank and detailed "Distance Education Report 2001" which established enlightening correlations among several variables and offers explanations (later reports which appeared on the internet no longer contained such unsupported views and appear to have been adjusted). The CCC presented the following figures for California Community Colleges in 2000:
|
California Community Colleges |
1995 |
2000 |
|
Amount of courses |
1.562 |
3.979 |
|
Students (enrollments!) |
54.525 |
104.153 |
|
% of total |
0,63% |
1,2% |
Table 4 - Online courses and enrollments
Here, the figures are impressive again, in particular the growth rate, but how does the distribution really look like? If we calculate the figures as a percentage of the sum of all courses at the California Community Colleges it becomes clear that the base level is very low: The 1,500 courses in 1995 make up just 0.63% of the total courses offered. Although the percentage rate climbed to 1.2% in 2000, it is still a very low base level. Furthermore, we know from almost all statistics on growth rates, that, as a result of the ceiling effect, the growth curve levels out at some point and no longer increases. The NCES study which forecasts student data until the year 2013 (NCES 2004-013)(50) suggests a continued growth in the number of students and graduates. However, I dare to question whether in light of the obvious subordinate role of eLearning in the American educational system the rate of online courses will increase to over 10%.
We can only use the period from 1995 to 2000 where online enrollments and courses almost doubled to benchmark future predictions in the area of online education. If we assume that these figures double every 5 years, we will reach a proportion of 4.8% of all courses in the USA by 2010. This is still not that much. But even if growth continued to increase exponentially or accelerated over the next few years, we have to expect that there will be a limit to the share online learning has in the education system. This will not be 100% or 50% but considerably lower. Even if this is pure speculation, the question of how high the limit will be is justified. Is it 10% or even 20%? Furthermore, what effects would these figures have on the education system?
Further observations put the significance of these numbers into perspective:
- The proportion of online teaching is not evenly distributed over the different types of colleges. To date private colleges have shown reluctance towards online training.
- The proportion of online teaching is not evenly distributed over the different college levels. The 2-year colleges have taken on the lions share.
- The proportion of online teaching is not evenly distributed amongst all faculties. Business Administration is at the forefront followed by courses which are, to date, relatively unknown to us, e.g. nursing [10].
- The proportion of online teaching is not even evenly distributed amongst the courses of a single college. Carol Twigg (2003)(38) refers to an internal study of the Maricopa Community Colleges in Arizona with more than 100,000 students registered and which offers more than 2,000 online courses. She reported that 25 of these courses made up 44% of enrollments (p.118) whilst the remaining 1,975 courses attracted only 56% of the students. Thus, there are some faculties or subjects which are responsible for almost half of all enrollments, comparable to the business or mathematic foundation courses for engineers in Germany, where overly large groups are taught. We can therefore assume that the "top 30 Postsecondary courses" determined by the NCES will also lead in a ranking of online degree courses (Wirt, Choy et al 2004, Indicator 30; NCES 2004-077)(56).
In other words, eLearning forms "clumps" in the education system and is definitely not an integral part of training evenly distributed throughout all types of colleges, college levels or faculties. This may also give cause for concern: If the number of enrollments is divided by the number of courses the result is an average of 28-30 students per course which means that there must be numerous very large courses offset by a lot of very small courses. This can be applied to both the data from the California Community Colleges and from the NCES. Indeed numbers of up to 200 students per online course can be found in some reports, dramatic numbers which demonstrate that online courses for economics will be as full as face-to-face courses which does not, in any way, comply with our visions of quality improvement.
The absolute figures of courses offered and booked as well as the numbers of registered students do not say anything about the factors responsible for the rapid development in the eLearning sector. One has to look beyond the figures to discover the reality of eLearning. I would now like to explore a slightly different line of thought by analyzing the reasons why students book online courses.
If one assumes that originally virtual colleges emerged to compete with traditional colleges or as an extension of distance education with a different technology (Schulmeister 2001)(30) and should have tempted students away from on-campus universities or even attract new students to online learning, then we can now say that this objective has not been achieved or only partly achieved because it turns out that most students who enrolled in online courses are registered at on-campus universities and are not reacting to the enticements of new technologies (CCC_Dist-Ed_2001)(10).
Under the heading "who are distance learners" the Western Interstate Commission for Higher Education (WICHE) commented their explanations on Distance Education as follows [ http://www.wiche.edu/ ]: [11]
"Distance learners are people who, because of time, geographic, or other constraints, choose not to attend a traditional classroom. Financial considerations, family obligations, or work requirements may point to distance education as an appropriate way to meet their educational goals."
These are all only assumptions, not unreasonable and in accordance with my observations, but are they really true? There is a fairly solid evaluation of the "reasons for choosing an online course" by the California Community College (2001)(10):
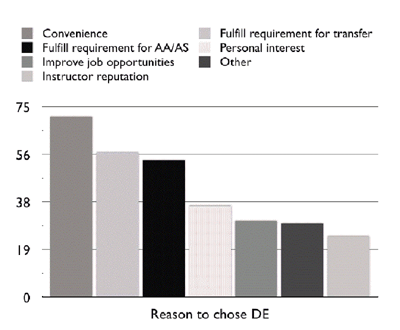
Figure 2 - Reasons to choose DE
Convenience is the biggest reason to choose an online course followed by fulfilling requirements for an Associate Degree and for the transfer to a bachelor program. The author of this study regrets that the reputation of the teaching staff did not play a major role in attracting people to eLearning. The results were similar two years later, only the position of some items changed slightly. The most important reasons for taking a DE course are its convenience (n = 3,208) followed by the need to fulfill requirements for an Associate Degree (n = 2,349) or fulfill requirements for transfer (n = 2,309) (CCC 2003)(12). Both items meaning the transfer to a bachelor program are at the top of the "reasons to choose a DE course" in the statistics. Europeans will find these statistics difficult to understand. I will try to interpret them. I will address the reason "convenience" first and deal with the reasons "requirements for transfer" and "requirements for AA /AS" in the next section.
What exactly is meant by 'convenience' which appears not only in the reasons to choose an online course but also in the presentation and promotion of colleges and universities? It means that you save on travel time ("no need for commuting"), have the comfort of studying at home and the opportunity to take a course whenever needed in order to combine work and study which allows for better time management. The comprehensive evaluation of online as well as face-to-face courses by the Research Initiative for Teaching Effectiveness of the University of Central Florida came to the conclusion that "The majority of students (79%) take fully online courses because of the convenience of not coming to campus" [ http://pegasus.cc.ucf.edu/~rite/impactevaluation.htm#Who ]. The report of the California Community Colleges (CCC 2001)(10) lists "the ability to fit courses into their daily schedule" as one of the main reasons, a definition which could be used to explain the term 'convenience'.
The EDUCASE [12] center for Applied Research published a study ECAR [13] which also lists 'convenience' as the main reason for student use of information technology (IT).
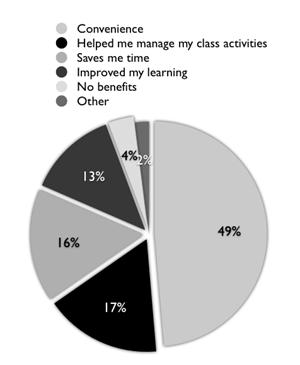
Figure 3 - Student motivation for the use of IT (Kvavik, Caruso and Morgan 2004)(21)
The ECAR study by Robert B. Kvavik, Judith B. Caruso and Glenda Morgan (2004)(21) reported that 'convenience' was also the main reason in student use of IT. The study carried out in 2004 questioned 9,350 freshmen and 9,050 senior students (response 4,374) as well as interviewing 132 students in focus groups at 6 colleges. The majority of students (48.5%) named convenience as the main motivation. If the reasons 'convenience' and 'save me time' are put together the total is 65%, whereas the reasons for support in learning, e.g. "helped me manage my class activities" (16.7%) and the organization of learning "improved my learning" (12.7%), summing up to a total of 29.5 %, play a lesser role, reasons which the authors would prefer to see at the forefront.
The replication of the ECAR study carried by Caruso and Kvavik a year later more or less consolidated these findings although they used a much bigger sample (140,000 students were asked, of which, more than 18,000 answered and 63 colleges participated). Since the assumption that the students, who responded voluntarily to this study, were those, who had already been acquainted with IT and modern media, is justified (as indicated by the data relating to computer ownership, broadband access, and use of LMS or CMS etc), the results on reasons for choosing a DE course are, therefore, of particular interest. [14] In 2005 the motivating factors were:
What does "fulfill requirements for AA/AS" mean? What does "fulfill requirements for transfer" mean? The abbreviations AA and AS refer to Associate Degree in Arts and Associate Degree in Science respectively. What is meant by this? An Associate Degree is an academic title which can be awarded by 2-year colleges on successful completion of an undergraduate course or by junior colleges after two years of study and thus allows the transfer to a 4-year college. The course is equivalent to the first two years of a bachelor program. There are two types of Associate Degrees:
"(1) Technological and vocational specialties that are generally completed in 2 yr. of college study and are usually sufficient for entrance into an occupational field, and (2) college or university parallel programs that are like the first 2 yr. of a 4yr college curriculum often referred to as a Transfer Degree. Examples - AS Degree in Accounting, AS Degree in Paralegal Studies (These programs generally require a minimum of 90 credits)." [ http://www.mtbaker.wednet.edu/career/definiti.htm ]
AS degrees enable the initial entry into an occupational field or the transfer to a 4-year college to get a bachelor degree. Those who choose the first option complete their studies for the time being but can return later. Students who take the second option want to get a bachelor degree. Clearly the 2-year colleges are chosen by the majority of students because course fees are much more reasonable and it is an inexpensive way of getting a transfer to a 4-year college. These colleges are also chosen by those whose applications to university were not successful because, for example, their SAT score was not high enough. Thus many students choose to go to a community college which enables the transfer to a bachelor institution later. In order to obtain the required credits many students in community colleges then choose online courses.
The observation that students, for the most part, take online courses at other colleges that are not offered by their own college [15] or in case they missed a course would seem to prove this point. The president of the Teachers College of Columbia University, Arthur Levine (2004 p.26)(23) is of the opinion that, in reality most people are more interested in studying on-campus "Many people are going to want a traditional campus experience, including students, and the parents who have waited 18 years for them to leave home, among others".
The requirements for the Associate Degree are similar to what is taught in the final year of secondary education. This is revealed by course descriptions. I have chosen a course from the Fingerlakes University which is reasonably detailed and clear in describing its requirements and is a step towards entering the State University of New York (SUNY). Here are some course extracts [ http://www.fingerlakes.edu/academics/degree_requirements.html ]:
|
AREA A English: Written Communication Applicable courses must satisfy the writing and composition requirement for graduation of the delivering institution. |
AREA B Critical Thinking (Satisfied through MS 120 & 220) Logical thought, critical evaluation, and clear and precise expression. Courses in this area have an oral presentation component allowing students to demonstrate their ability to persuade, debate, argue or inform in a clear, concise and logical manner. Emphasis is on content and delivery in the foreign language. |
|
AREA C Science (Course must include a lab.) Understanding scientific methods and achievements of at least one of the biological or physical sciences. |
AREA D Humanities (Satisfied through AS 140, 240 &340) Appreciation, understanding, and sensitivity for artistic and cultural creation and expression. Courses in this area have components in the fine and performing arts, the literature of the language as well as the philosophy and religion of the language area. |
|
AREA E Social Science 3 A general understanding of American History, World History, Western Civilization, and/or U.S. Government. Courses fulfilling this requirement should be general survey courses on World/U.S. History or U.S. National Government. |
AREA F Technology 3 Hands-on use of computers in today's work environment. Use of desktop computers; techniques of word processing, databases and spreadsheets; web searches, concerns of virus prevention and detection; and data security. (Computer history, hardware design, computer maintenance and management of computer systems are not acceptable.) |
The courses are general education courses on history, science, the humanities and social science that also cover the propaedeutic tasks of creative writing, critical thinking as well as the use of computer technology. The level of these course subjects can be deducted from their descriptions. English is basically the main subject of the "General Education Course Requirements for Transfer Programs" and sport (physical education) is obligatory. A form containing sport courses which are to be taken is attached to the course lists.
I would like to take this opportunity to emphasize that I do not wish to criticize the standard of content or to criticize the fact that physical education, gymnastics and sport are part of the general education repertoire; after all, they are courses similar to those in the final year of a secondary school. Conversely, it must be attested that we are not dealing with what we regard as an academic course of studies and that we cannot not play the 4-year American bachelor off against the 3 year German bachelor (at least not as long as the current system is in use: 13 years to final secondary school exams).
Meeting the requirements needed to transfer to a 4-year college and bachelor program [16] is what is meant by "requirements for transfer". It can also apply to courses which have to be taken before the actual course of studies at a 4-year college begins. Many courses are booked in order to catch up on course work or to make up for seminars. The term "remedial coursework" is openly used here. This behavior is not restricted to online courses, on the contrary, online courses are adapting to the educational environment, as Wirt, Choy et al (2004)(56) in the NCES report "The Condition of Education" (especially indicator 31 titled "Remedial course taking"; NCES 2004-077)(51) explicitly stated "American Colleges or Highschools offer 28% of their students 'remedial courses' and the 2-year colleges offer them to even more, namely, 42% of their students". eLearning has become an integral part of the long standing tradition of remedial teaching in the USA. Incidentally, remedial courses are part of a study system which was not taken into consideration when bachelor programs were introduced in Europe but which will probably have to be made up for quickly in the future. Similar educational structures can be found in Switzerland and these courses are known there as "mise à niveau" courses.
Online courses are even used by pupils in the 11th or 12th grade, similar to students at community colleges and universities, for remedial purposes:
"The most common reason students (i.e. pupils, R.S.) take Class.com courses is for credit recovery. Common credit recovery applications include remediation, summer school, alternative education, and other programs aimed at closing achievement gaps." [ http://www.class.com/content/4/real_world.pdf ]
The main reason is to fill achievement gaps, to acquire missing credits known as "credit recovery" or the repetition of failed, badly graded or missed courses known as "remedial course taking". It is easier to combine the virtual repetition of a course with the study plan at a university, and students do not have to wait a whole academic year before the course in question is repeated on-campus. Pupils rank their motivation as follows [17]:
|
Making up credits |
23% |
|
Scheduling conflict |
22% |
|
Accelerating graduation |
18% |
|
Prefer online courses |
16% |
|
Cyber/Home school |
7% |
|
Courses no offered at my school |
6% |
|
Medical problems |
3% |
|
Teacher/School conflict |
3% |
|
Other |
2% |
Table 6 - Reasons for choosing online courses
The Indiana State University set up a Weblog to answer the question "why chose distance education" [ http://www.indstate.edu/distance/viewpoint/chose.html ]. Students named meeting the demands of family life and or their job as one of the main reasons for choosing an online course:
"I received a job promotion that required me to move out of state. Rather than decline the job offer or postpone my work toward my Master's, I decided to try the distance education program";
"I work from 7:00 till 4:30 most days and have an hour's commute from home so my time is limited";
"Convenience is major advantage. Long commuting time are cut down due to ability to communicate via www and/or e-mail. Thus, it is much easier to spend time with my husband & 3 children that would otherwise be used for travel to & from campus."
Other reasons are also mentioned and 'convenience' occurs along with other motivating factors (performance, motivation to learn, self-instruction):
"Five years ago, when I returned to school for my master's degree, I had never used a windows program. Now I am composing spreadsheets, setting up databases and doing a great deal of research online utilizing remote access to libraries. The work that I have done has provided me with the exposure to possibilities that I had never dreamed of before. It has forced me to stretch, to get out of my comfort zone."
"For one, it enables me to work full-time and go to school full-time to pursue a degree. I also enjoy self-instruction; I learn a lot more and can work at my own pace, which is fast so deadlines are met";
At the end of this trip through American college statistics the fact remains that the high number of online courses in the USA is caused by following factors:
Firstly, it appears that a lot of online students are primarily interested in preparing for an academic course of studies. It is not yet a bachelor program which motivates students at Community Colleges to book online courses (transfer degrees).
Secondly, it appears difficult for those students who wish to get a place at a university via the 2-year colleges to earn the required credits at their own college, and they therefore have to book extra online courses at other institutions.
Thirdly, the rigid school like structure of postsecondary education in America leads to missed courses, loss of credits and time wasting, all of which can be prevented by taking online courses parallel to their on-campus courses (the reasons "remedial course taking" and "credit recovery"). However, these are not sound reasons for German education policy-makers to overestimate the importance of eLearning in the USA, as has been done in the past few years.
Fourthly, it is not modern technology and the internet which sways people toward an online course but the convenient balance between work and daily life since the majority of students work to earn a living and pay for their own tuition fees and expenses.
Fifthly, a large group of online students is made up, on the one hand, of those in the workforce who would like to study, and on the other hand, of students who have to work to pay their tuition fees and expenses.
Ali Baker and Laura Horn (2003)(5) examined the differences between employees who study and students who work in their study for the NCES titled "Work First, Study Second". Wirt, Choy et al (2004)(56) took on and examined the distinction between "Employees who study" in their study for the NCES titled "The Condition of Learning" (Indicator 29) and came to the conclusion:
"Approximately one-third of undergraduates are older students who are combining school and work: 43 percent of 1999-2000 undergraduates were age 24 and above, and, of those students, 82 percent worked while enrolled (NCES 2002-168). Furthermore, about two thirds of these older working students characterized themselves as primarily 'employees who studied,' as opposed to 'students who worked to meet their educational expenses' (NCES 2003-167)(48)."
Many see themselves first as employees and second as students (NCES: The Condition of Education 2004, p.81)(51). In line with these observations, most students who signed up for online courses are enrolled at brick-and-mortar universities (CCC 2001)(10). Many book just one online course, namely a particular course whose credit they need but which is not offered by their college, or which they missed, or because it is easier to combine the online course with their work schedule. Similar reasoning, although not as extreme, can also be applied to Canadian distance education:
"Similar to higher education institutions in the U.S., Canadian institutions are seeing a growing trend of on-campus students going online for at least a portion of their education. Thirty-five percent of 18,000 distance education course enrollments at UW are from students who are pursuing their degrees on campus."
"At the University of Manitoba (UM), where 3,500 students are enrolled in 25,000 distance education credit hours, more than 60 percent are a subset of the on-campus population." (George Lorenzo 2004)(24)
These may be trivial motives for some European eLearning protagonists but they are real reasons and real figures which should be taken into serious consideration. If we take a look behind these reasons we would probably discover that the expansion of online college education is thanks to two factors: The rigid American college system with its numerous performance tests which force students to acquire the necessary requirements in unusual ways, as well as the existence of IT which enables students to achieve this goal, in the most convenient way possible, namely regardless of time and place. Following this digression we must now ask ourselves, if we, as didactical experts, developers and designers, had these motives in mind when we began to address the fascinating world of eLearning, and if it was ever our intention to offer eLearning to this clientele.
The pressure the American system of study puts on students trickles down through the educational system. Most universities use the SAT [18] to test their applicants, a test which is made up of a verbal competency part (maximum 800 points) and a mathematical part (also maximum 800 points). The skills measured by this test can be trained which is one of the reasons why, in the history of the SAT, the national average of college applicants has increased constantly.
This has led to pupils training at a young age for the university entrance test. Frontline [ http://www.pbs.org/wgbh/pages/frontline/ ], a current affairs programme which is a part of the channel PBS [ http://www.pbs.org ] and is one of the few critical news magazines in the USA, made an informative short film [ http://video.pbs.org:8080/ramgen/wgbh/pages/frontline/excerpts/1802.rm ] on the subject of pupils and SAT scores. This short film gives clear insight into the pressure put on 13 and 14 year old pupils to train, with the aid of stupid drills, for a SAT score of at least 1500 points. At this point I would like to quote the most significant passages from the film:

Figure 4 - Scenes from the Frontline film "Secrets of the SAT" (Video)
SECRETS OF THE SAT
Written, produced and directed by Michael Chandler
A Frontline Movie
|
Narrator: |
In a few days, millions of American teenagers will take a test that will determine their future. They have spent thousands of hours and thousands of dollars, obsessed with higher scores. But what do the SATs really measure? And are they fair? Tonight on FRONTLINE, the real Secrets of the SAT. [...] |
|
Narrator: |
On Saturday, October 9th, half a million American teenagers -mostly high school seniors - will take the most important test in their young lives, the SAT. |
|
Pupil: |
[...] |
|
Teacher: |
[...] |
|
Narrator: |
The SAT is a three-hour multiple-choice examination of verbal and math skills. A perfect score is 1600 points. It has become a very important number for kids who want to get into America's top universities. |
|
Teacher: |
[...] |
|
Pupil: |
[...] |
|
Narrator: |
The average SAT scores for students admitted to Princeton is 1465; MIT, 1475; Harvard, 1495; and Stanford, 1500. |
|
Tutor: |
[is sitting in front of a student of Asian descent] "And so your SAT-1 is - don't tell me. It's 1570?" |
|
Student: |
"No." |
|
Tutor: |
"Fifteen-ninety?" |
|
Student: |
"No". |
|
Tutor: |
"Fifteen-sixty?" |
|
Student: |
"No." |
|
Tutor: |
"What?" |
|
Student: |
"Fifteen-fifty". |
|
Tutor: |
"Boy! All this rumor around school that you were actually smarter than you are." [In the background a teacher is speaking to a group of pupils practicing the SAT test ...]. |
|
Narrator: |
An entire industry has grown up dedicated to raising test scores, beginning at a younger and younger age. |
|
Teacher: |
[is discussing an exercise with a prep-group] |
|
Narrator: |
In a storefront off the Pacific Coast Highway in Laguna Beach, California, 13- and 14-year-olds practice for their SATs in a program called The Cambridge Colloquium. It costs $500 a year and lasts for five years. |
|
Lisa Muehle, Teacher: |
[...] [2 pupils who see SAT training in a positive light. A test situation is simulated. The pupils are asked what score they are aiming.] |
|
Answer: |
1500. [all nod in agreement.] |
|
Muehle: |
This is not your dad's SAT anymore, okay? It's a whole different world. You don't show up to the SAT anymore without some prep because the SAT, along with your grade-point average, are the two most important criteria that college admissions departments look at. |
|
Mother: |
just see how competitive it is to get in college now. And I can't imagine going through what they're going through. |
Presumably, not all parents who would have liked to send their kids to college can afford this type of SAT training, which takes years, and who wants to spend an afternoon every week doing this type of additional training. This shows how far the expectations of the bachelor society have already infiltrated the minds of young pupils.
As if this not enough, from their first day of school, pupils whose parents can afford this are used to taking extra lessons in addition to their school lessons. Now, because it is cheaper, they are receiving these extra lessons from tutors organised in call centres in India in the form of e-lessons, e-tutoring or e-mentoring live via the internet:


Figure 5 - An Indian call center for tuition and tutors and 2 pupils.
[New York Times online]

Figure 6 - International Herald Tribune 8.9.2005, p.14
[Reprint of a New York Times article]
It has become clear: The rules of the BA/MA system relocate the pressure down, in biographical terms, to earlier learning phases. At the same time it is also a costly investment for both parents and students to keep pace with. I do not hesitate to refer to these latest political developments in education as a new form of social Darwinism.
American math students also do not want to miss out on the reasonably priced services of the Indians who are known for their mathematical expertise. The Indian press is pleased by the demands of American students and about the additional sources of income for the country, as reported in some newspapers in August 2005:
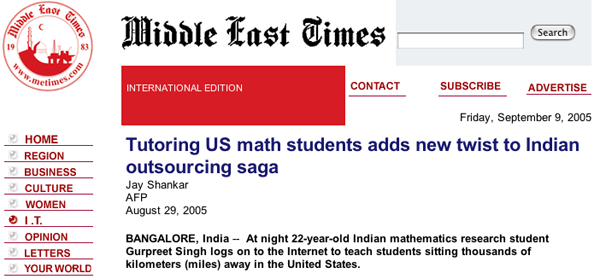
Figure 7 - Middle East Times Online 29.08.2005
The tuition services offered by Indian math experts can only be topped by the "professional" advice offered "Thesis and Dissertation Advisors on Call" [ http://www.dissertationadvisors.com/ ] or "dissertations.com" [ http://www.dissertations.com ] (not to be confused with the publisher of dissertations, dissertation.com) on whose website thank you letters from near failed PhD students testify to the beneficial effects of these tutoring agencies.
Figure 8 - Consultancy service for Doctorates.
There are not only diversities between working students and employees who study or between students at 2-year colleges and students at 4-year colleges and universities but also other, quite different diversities. A look at the role of ethnicity in Distance Education gives further reason to exercise caution when interpreting American statistics. It is not new that discrimination exists both in society and the education system, be it based on reasons of social class, ethnicity or disability. Many scientists and lecturers who were involved with eLearning from an early stage shared the expectation that societal discrepancies could be reduced by eLearning. However, it is a new barrier which has produced the differences between groups of students which led to discrimination in the education system. It refers to the impression that students are at an additional disadvantage because they do not have access of computer aided courses. The digital divide seems to be getting bigger.
"The data for August 2000 from the NTIA study show that divides still existed between different racial and ethnic groups, old and young, single- and dual-parent families, and those with and without disabilities" (NTIA 2000)(28).
But, most probably, this is not an access problem alone. It is a predominantly social and cultural phenomenon, and there are some indicators confirming this. The U.S. Census Bureau (2003) stated in its report on college degrees of the various ethnic groups acquired over the age of 25, that 50% of Asian students have achieved a bachelor degree, whereas only 30% of White students and 17% of Black students and only 10% of Hispanic students are successful. It must be noted that age groups are included in this sample (25 and over), for example those over 50, to whom a degree did not mean as much as to younger students between 25 and 29.
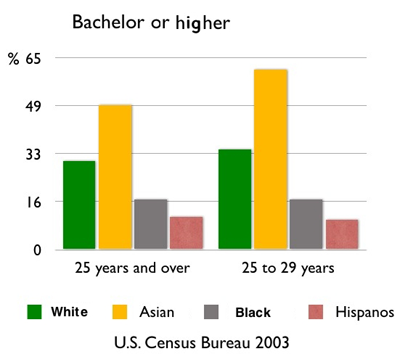
Figure 9 - Bachelor graduates according to age and ethnicity.
If we only look at the data for the 25 to 29 year olds, i.e. the sample of those who have just graduated, it is obvious that the proportion of Asian students increases to 62%, whereas the results for the other groups stagnate. This suggests that Asian students are on the fast track and have not yet realized their fullest potential. This impression is strengthened when High-School data is compared to College data:
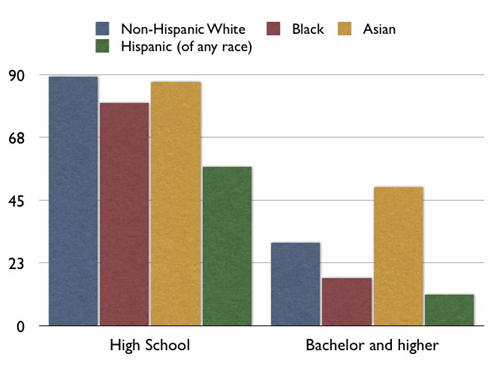
Figure 10 - School and bachelor graduates according to ethnicity (U.S. Census Bureau 2004)
The distinctiveness of the Asian sample becomes even clearer when compared to high school diploma data. I am not referring to the fact that the number of college degrees is lower than that of high school diplomas-that goes without saying-but I am referring to the observation that the figures for high school diplomas are relatively close for the different ethnic groups (apart from Hispanic), but the groups drift apart when it comes the level of college degree achieved.
The Asians have the same position as the Whites in high school but take the lead in college, whereas the numbers of Black or African American students, 80% of whom achieved their High School Diploma, sharply decrease in college. Hispanic students did not do very well in high school and do even less well in college. The Asian students have, by far, overtaken all other groups. As a result of this comparison the head start earned by the Asian students at high school level becomes even more significant. If the proportion of citizens of Asian descent in the American population were higher than it is, then this result would not please conservative Americans.
Let us turn to the differences between Whites and Blacks as well as Whites and Hispanics. This is where the Digital Divide becomes apparent. Even if the national performance trend has been slowly increasing as stated in the latest National Assessment of Educational Progress NAEP study known as "The Nations report card" [ http://nces.ed.gov/nationsreportcard/about/ ], the gap between Whites and Blacks and Hispanics has more or less remained constant. The Long Term Trend Assessment carried out by the NAEP in 2004 does not include Asian students in its analysis. However, according to the analysis made by William Bowen and Derek Bok 1998 (7), we can expect an even less favorable forecast: "Most troubling of all, a recent study suggests that the black-white gap in test scores among high schools seniors may actually widen over the next few years." (p.23)
These findings are not restricted to the USA. Similar results, for various ethnic groups, can be found in other Anglo Saxon countries belonging to the Commonwealth. Josef Hvorecky, a Slovakian college lecturer from Bratislava who gave online courses for the University of Liverpool, reported on his 7 online courses, in which 109 students from 18 countries participated, and on the impact virtual courses had on the digital divide:
"Despite the large variety of countries and the students' good study results, the author becomes more and more convinced that the Digital Divide is widening".
How does Josef Hvorecky come to this conclusion? The largest group of students came from England. More than half came from different countries, of which only 4 were developing countries, each represented by 1 student (China, Iran, Jamaica and Tanzania). If one considers the nationality of theses students, we get a different picture. The number of nationalities is smaller than the number of countries. In total, 22 students came from developing countries but lived in England. Josef Hvorecky sees this as an indication to the existence of a "brain drain". In other words, eLearning does not achieve the aim of giving students from developing countries the opportunity to study.
Apart from ethnic diversity and the digital divide between rich and third world countries, there is also an institutional barrier. The NPEC (2004)(26) spoke about the "Postsecondary Educational Digital Divide" and speculates that because 4-year universities have bigger capacities than smaller institutions, they could, therefore, out maneuver them, because "according to NCES, technology-mediated distance education was related to institutional size; distance education courses were more likely to be offered by medium and large institutions than by small institutions". In my opinion this concern has yet to be proven. But it is worth considering that smaller institutions might specialize on a high standard of face-to-face teaching in order to remain competitive whereas, with the aid of eLearning support, larger institutions might triy to modernize the teaching of the masses.
Even though the picture painted by American statistics of eLearning is very different to what we expected, does at least the quality of eLearning in America meet our expectations? There are a number of factors which could be considered as an indication of didactical quality. I count the type of media support, the academic qualifications and the status of the teaching staff, the attrition rates and the retention rates as well as the satisfaction of students with their online courses as criteria for quality. I will try to find statistical data which supports some of the above mentioned indicators in order to paint a more precise picture of the quality of eLearning.
Reports from California Community Colleges (2001)(10) provide detailed data on the use of media in online courses. Their data is, however, restricted to the plain use of media in online courses. No data has been gathered to answer the more controversial question of how multimedia technology is used for didactical aims.
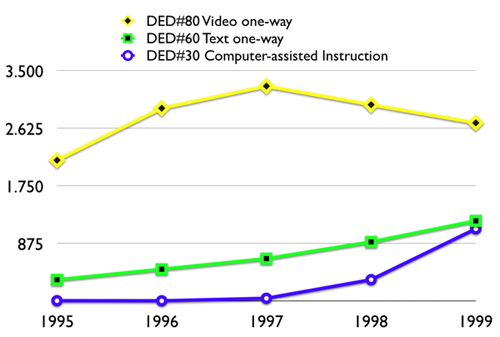
Figure 11 - Use of Media in online courses (CCC2001)(10)
The technology used most is DED#80, the dispatch of lectures on video. DED#30 represents the dispatch of written assignments, the correspondence type of paper mail used previously in Distance Education. DED#60 means computer aided learning which started to increase in 1997. In 2000 the National Education Association (NEA 2000) was still reporting a majority of video based distance courses: "We see two basic types of distance learning courses: Web-based courses (44%) and those relying primarily on video technologies (54%)". In America, Distance Education availed of several distribution channels whereby dispatch and video broadcast dominated for a long time. The internet is not "the predominant distance learning technologies. That honour goes to live video instruction, which is the most popular and fastest growing distance education delivery mode in the United States" [ http://www.cete.org/acve/docgen.asp?tbl=mr&ID=88 ].
The data from the CCC Report is worth noting because it clearly shows that the development of media instruction in Distance Education took a dramatic turn in 2001 and 2002: Internet technology was not used until 7 years after its introduction. Whereas the use of video, text and other technologies have come to a standstill, the use of internet based courses has increased greatly:
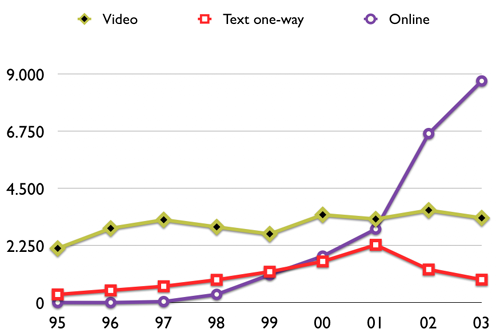
Figure 12 - Use of media 2003/2004 (CCC 2005)(13)
Video, television and Computer Assisted Instruction (CAI) have only made slight gains whereas from the year 2001, the use of the internet increased sharply [19]. This increase does not necessarily mean that we find ourselves in the midst of an interactive revolution in digital classrooms, but although Distance Education in the USA is now mainly electronically based, it remains as in the past for the most part an electronically based correspondence course. The question what constitutes didactical quality is not answered by the technology used but by the method used to implement it. Internet courses also take on the form of a correspondence course when the digital texts are only being offered as downloads.
This is hinted at in statistics compiled by Rhonda M. Epper and Myk Garn (2003)(18) for the State Higher Education Executive Officers (SHEEO) and the Western Cooperative for Educational Telecommunications (WCET). A total of 61 Virtual Colleges and University Consortia which were mainly independent virtual spin offs from bricks-and-mortar universities were asked. Data is on hand from 51 of these institutions, according to which, 100% of them use the internet, but other methods and media are also used. However, video is still one of the most popular technologies. There are three versions of Video broadcast, as ITV compressed video 56.9%, by satellite (33.3%) and by cable (43.1%), and there are three modes, correspondence mode (35.5%), face-to-face lessons 15.7%, and a rather inventive version, which has not yet been mentioned, called the "Traveling Teacher" (11.8%).
Zemsky and Massy (2004)(57) see no change to the multimedia nature of Distance Education as a result of the use of the internet because it is mainly used as a method of distribution: "For the most part, however, what the Web provides are merely correspondence courses distributed electronically". Friedrich Hesse also emphasized this impression in his report on his journey with State Secretary Uwe Thomas in the USA (Thomas 2001)(35): "Accordingly, net-based learning structures are strongly oriented towards the old metaphor of classic teaching methods, and, in most cases have been transferred on a 1:1 ratio". He regards this as being directly related to the commercial orientation of American third level education policy, which was initially seen as a strength, as well as the resulting time pressure which is not suitable for nurturing new concepts. He gives a sober assessment of American eLearning: "If one were to describe the whole online scene-insofar as learning, teaching and knowledge processes are concerned-one would have to say that it is not very visionary".
It is not only the role played by multimedia technology which is relevant for the success of students or the quality of training, but also the significance of the didactical concept or the used and preferred models of learning. There is no data available on this problem. No data was compiled on these questions in the surveys probably because the questions were not of great importance to the questioners.
Unfortunately, all known data is relatively unreliable. The results from a survey carried out by the NCES (2003)(47) show that colleges and universities offer internet courses in the form of synchronous and asynchronous computer aided learning as well as working with video. I am not going to show the whole table here, only the results for the 4-year state colleges:
|
Media used or mode of distribution |
% |
|
Two-way video with two-way audio |
80 |
|
One-way video with two-way audio |
15 |
|
One-way live video |
13 |
|
One-way Prerecorded video |
40 |
|
Two-way audio transmission |
11 |
|
One-way audio transmission |
10 |
|
Synchronous Internet courses |
55 |
|
Asynchronous Internet courses |
87 |
|
CD-ROM |
29 |
|
Multimode packages |
29 |
|
Other Technologies |
5 |
Table 7 - Online courses and Media used (NCES 2003-017, Table 10)(47).
The table with values of over 100% is difficult to read. For example it is not clear what is meant by the term "two-way video with two-way audio" which makes up a large part of the figures. Does it mean interactive teaching in small groups in a virtual classroom or a lecture with a minimum feedback channel? How does this high figure correspond to the fact that the number of asynchronous courses ist really larger than the number of synchronous courses? What exactly is meant by "asynchronous internet courses"? If we sum up all types of video and audio transmissions (two-way, one-way, live, prerecorded) what may be the result? The survey clearly shows that the media environment is becoming more diverse; however no conclusions can be drawn from the table with regard to didactical design.
However, the fact that most online course participants are also registered at on-campus colleges brings the authors of the California Community Colleges (2001)(10) to the conclusion that it is not the technology which attracts student to online courses: "The hope that new DE delivery technologies would attract those students living some distance from their community college campus appears to be unfounded". It is not the new technologies as such which have led to an increase in enrollments for internet-based distance education courses but the convenient nature of these new technologies: "the ability to fit courses into their daily schedule is the chief reason students take DE classes".
The teaching staff, their training, their academic rank and their teaching qualifications are all important variables in the quality of online teaching. According to NCES (2002) about 6% of teaching staff offer at least one online course (Ellen M. Bradburn, NCES 2000-155)(43). The National Education Association (NEA 2000) assumes that one in every ten college lecturer offers an online course. With this in mind, the quality brought into virtual teaching, is of great interest to me.
Several statistical overviews of Distance Education are interested in the participation rates of teachers from various ethnic groups (Ellen M. Bradburn & Linda Zimbler, NCES Statistical Analysis Report. Distance Education Instruction by Postsecondary Faculty and Staff: Fall 1998, 2002-155):
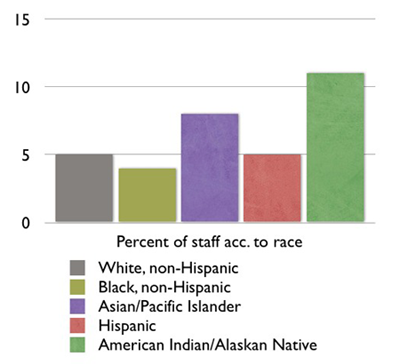
Figure 13 - Teaching staff in online courses as a percentage of their ethnic group (NCES 2002)(43)
The proportion of teaching staff who offer online courses is between 5 and 12 percent of each ethnic group. However, it stands out that teachers of Asian descent and teachers in the Indian/Alaska group have higher rates of participation in eLearning than teachers from other ethnic groups. This could, in part, be explained by the minority status. The low success rates of Blacks have appeared quite often in the statistics discussed here.
Clear differences can be found when data compiled on the qualifications of teaching staff by the National Education association is compared to that of other institutions e.g. California Community Colleges. Colleges which offer conventional face-to-face teaching show a good balance between professors and assistant lecturers whereas the teaching staff at virtual institutions do not always have degrees of particularly high quality. Statistics from the U.S. Departments of Education and the NCES (Bradburn & Zimbler, NCES 2002, 155)(43) show to which degree, teachers of varying rank are involved in online courses:
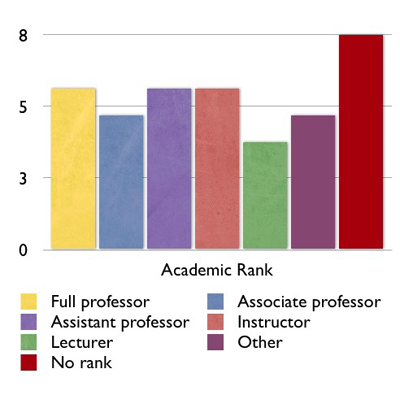
Figure 14 - Teaching staff according to rank (NCES 2002)
Each group has the same degree of participation in online courses. It is slightly higher for the teachers who have no rank. This is understandable because this group is looking for employment possibilities, is dependent on smaller teaching positions or would like to include proof of teaching positions held in their teaching portfolios. What are the absolute figures of distribution like? It was mentioned (CCC 2001)(10) that in some cases permanent faculty members earned additional income by giving online courses: "Full-time faculty who taught classes offered through distance education programs earned about $1,700 more in additional institutional income (beyond their basic salary) than those who did not teach such classes". Could this be a real incentive for some?
A look at the participation of teaching staff according to their academic degree shows that those with a Doctorate participate in online teaching to a lesser extent than other groups:
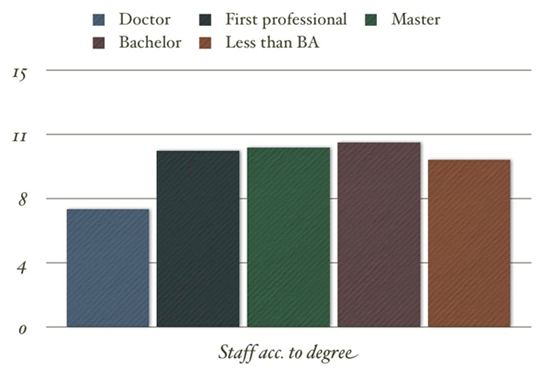
Figure 15 - Teaching staff according to academic degree
Even those with First-professional degrees have a higher rate of participation than those with a Doctorate. If we do not take the First professional degrees into consideration [ http://nces.ed.gov/programs/digest/d03/tables/dt274.asp&e=10401 ] [20], then it becomes clear that the formal academic qualification as well as the professional standard of teachers is quite low, an observation which is supported by the fact that the majority of teachers do not have a permanent position at a college (NCES 2002)(43).
"Among those who taught distance education classes, part-time faculty, those with temporary appointments, and those without faculty status taught a higher proportion of their classes through distance education programs than full-time staff, regular appointees, and respondents with faculty status, respectively".
The recruitment of part-time staff has been criticized by the American Federation of Teachers (AFT 2003)(1), aiming at Phoenix University Online and Jones International University (JIU): "At the time it was accredited, for example, 96 percent (54 out of 56) of JIU faculty members were hired part time". Perhaps virtual teaching is proving to be a comfortable way of teaching courses especially for those who do not have a permanent position in a college and for whom, the journey to college may not really be worth it. [21]
The fact that teachers are only recruited for a particular course makes this problem worse. The practice of "hiring on a course-by-course basis" (Bradburn & Zimbler; NCES 2002-155)(43), is becoming a business principle. This leads to faculties being understaffed, a "part-time faculty", as well as resulting in "those with temporary appointments, and those without faculty status taught a higher proportion of their classes through distance education programs than full-time staff". NCES reported that 68% of the courses are given by freelance teachers and only 41% of the courses are given by faculty members.
Apart from the propagandists of virtual universities and virtual study (see Schulmeister 2001)(30) there are some in the USA who criticize this development. For example Mitchel Resnick (2002)(29) from the Medias Lab at the MIT speaks critically of the didactical use of technology in lessons in general:
"In most places where new technologies are being used in education today, the technologies are used simply to reinforce outmoded approaches to learning. Even as scientific and technological advances are transforming agriculture, medicine, and industry, ideas about and approaches to teaching and learning remain largely unchanged. To take full advantage of new technologies, we need to fundamentally rethink our approaches to learning and education-and our ideas of how new technologies can support them".
Carol Twigg (2003)(38) also clearly expressed that eLearning has not yet led to any new approaches to learning: "To date, when we have applied technology to higher education, we have simply bolted technology onto our existing formats" (p.117). This is also emphasized by the American Federation of Teachers (AFT 2003)(1): "Today most DE courses are simply online versions of traditional courses, which means that DE has affected higher education but has not fundamentally changed the nature of the student-teacher interaction". As a result of this the AFT calls for "Interactive DE" and Blended Learning. The long time President of Harvard University Derek Bok (2003, p.171)(6) says this type of inferior teaching is a result of the costs which high-quality teaching would incur and which, in turn, would lead to bigger groups with a lower rate of student care and support:
"In order to enlarge the size of their audience, providers will favor simpler material over more intellectually demanding coursework. By minimizing interactivity, they will cause their students to learn less. In these ways, the profit motive will lead universities to offer inferior instruction by trading their reputation and on the gullibility of their students".
Will this situation really improve? Or will we all succumb to the pressure to reduce costs?
Neil Terry (2001)(34) compared the attrition rates of 15 economics courses which in three years were held at least once as a face-to-face course and once as an online course whereby the same course was held each time by the same professor regardless of mode of delivery. The enrollments and attritions were registered. Attention was paid to ensure that methods, processes and material were, insofar as possible, the same in both modes. The result was not surprising. The attrition rate was higher for the online courses. Terry sees this as being related to a different type of didactics, the scialization of students, and the lack of teacher experience with this didactical method:
"Potential explanations for the higher attrition rates include students not being able to adjust to the self-paced approach in the virtual format, the rigor of study being more difficult than students anticipated, and a lack of student and faculty experience with the instruction mode."
The Research Initiative for Teaching Effectiveness (RITE!) at the University of Central Florida (UCF) makes a distinction between three different types of courses: face-to-face courses without media use, face-to-face courses accompanied by network based learning material known as web-enhanced courses and fully online courses. The Initiative determined the following grading [ http://pegasus.cc.ucf.edu/~rite/impactevaluation.htm#Who ] in their evaluation of withdrawal and success rates:
"On the average, Web-enhanced courses have higher success rates (percentage of students obtaining an A, B, or C) and lower withdrawal rates than their comparable face-to-face courses.
On the average, fully online courses have slightly lower success rates and higher withdrawal rates than either their face-to-face or Web-enhanced counterparts".
In other words: a certain amount of technology is helpful whereas fully online courses contain elements of risk. The UCF found that the following factors were reasons for withdrawing from a course: technical problems, underestimating academic expectations and private problems. [22]
However the results of eight case studies based on virtual seminars with between 8 and 20 participants compiled and analyzed by Sue Timmis, Ross O'leary et al (2004)(37) in the SOLE project (Students' Online Learning Experiences Project) [ http://sole.ilrt.bris.ac.uk ] point to didactical factors:
"There are a number of examples amongst these case studies where the implicit and explicit learning models were not aligned due to factors such as the underlying perception that students were passive recipients rather than partners in the learning experience."
Sue Timmis et al see the lack of participation in online communication as a problem which hinders the motivation of the students as well as the tutors and the intended learning model. They are also convinced that it will not be possible to change student expectations on the role of tutors "students still look to tutors for leadership". It is also possible that it is not the lack of participation in online communication which is responsible for course withdrawal but the communication deficits of online courses in general which has also been caused by the lack of teacher experience in this field.
The Sloan Consortium (2003)(32) [ http://www.sloan-c.org ] examined the data of 60,000 U.S. distance students, based on the data of the National Postsecondary Student Aid Society 1999-2000, to find out how they did in the widely used American college entrance test, i.e. their SAT score, and compared it to their satisfaction with Distance Education. The SAT scores were divided into four categories which showed that those with the lowest SAT score were the most satisfied with Distance Education (32%) and criticized it less than others (19%). Those with the highest SAT score were the least satisfied (8%) and criticized it the most (44%):
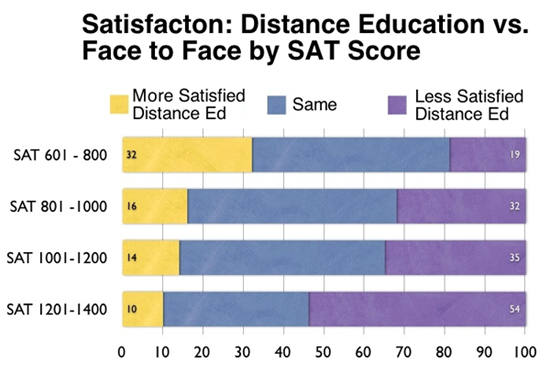
Figure 16 - SAT Score versus satisfaction with DE
The picture is clear: Students with the lowest competence levels [23] are more likely to be satisfied with Distance Education and criticize it less than those with the highest competence levels. The percentage of dissatisfaction with Distance Education and the resulting criticism increases with the degree of competence. The picture is clear but the reasons difficult to interpret. I believe that it represents an indirect judgment of the didactical quality and perhaps the result should be interpreted as follows: Students with lower competence levels are offered what they need, e.g. clear instructions in an assignment-oriented virtual course, whereas the more competent students would prefer didactical methods which demand more from them and are less restrictive. This could be indicated by the fact that the data revealed no further distinctions between age, institution, mode and media.
If there is even a grain of truth in this interpretation, the study carried out by the Sloan Consortium can then be seen as a criticism of the quality of online courses. Can a preference for face-to-face learning be found in the dissatisfaction of the more competent students with online learning? Is the criticism made by the more competent students also a way of stating that they are under challenged by the curriculum offered by the online course?
Satisfaction is not an independent variable. It is therefore necessary to look for factors to explain satisfaction differentially. A variable like satisfaction with Distance Education or eLearning has to be differentiated for groups of students and explained by independent variables. One of the biggest mistakes in eLearning is the choice of a learning model which does not take student diversity into consideration and does not allow student-centered learning: "All too frequently, even innovative institutions fall back on a one-fits-all approach [...] forgetting that students are different and have different needs", warns Carol Twigg [ http://www.center.rpi.edu ].
Are there more than 3 million students active in eLearning in the USA? One comes across incredible numbers at first glance. However, an intensive analysis of the statistics can show that these large numbers which should prove the effectiveness, quality and the profitability of American Distance Education are not accurate. As a result of my strenuous journey through American statistics I found out that eLearning in the USA is composed of a misfortunate alliance between, on the one hand, pragmatic and economic decisions and on the other hand the amalgamation of student attitudes, an alliance which has elevated the principles of feasibility and "quick & dirty" to the highest position.
What impact does this analysis have on the current debate on the introduction of eLearning in Europe? I remind myself (not reluctantly) that, in the last decades, those of us involved in university didactics, and, in particular in the discussion on multimedia and eLearning in the last decade have always represented and propagated valuable didactical goals and concepts.
In the past I have pleaded for open learning environments, developed methods for self-directed learning [24], emphasized the importance of communication and interaction in the learning process, analyzed the role played by the authenticity of content and needs of learning, sketched ideas for constructive assignments, followed with interest the spread of problem-oriented learning in medical education, developed educational software to meet the challenges of learning by doing, devised project-oriented instruction and emphasized the importance played by academic discourse in learning.
When we realize the consequences of the American Education system, we must ask ourselves whether European bachelor models could also be facing similar consequences. Students have a heavy workload and in their pursuit of high grades have to find a balance between their professional and private lives, and thus long for "convenience". The high percentage of "remedial courses" is a result of the rigid nature of postsecondary education as well as low quality online courses. eLearning in the USA is about to become a tool to repair the bachelor model, a model which has become a problem. With this trend in mind, we must ask ourselves if we are well on the way to copy precisely these developments. It is not that far removed to apply the findings of US college statistics to us because, with the implementation of Bologna, we are in the process of approaching the American study model when we
-
introduce bachelor and master programs (only 3 year)
-
abandon the thirteenth school year which was the reason for the 3-year bachelor
-
select students in a way other than a final exam at the end of secondary school "Abitur", namely based on applications, colleges entrance exams similar to the SAT or the ACT and by personal interview
-
introduce college/university study fees
-
admit part-time students to college as part-time students.
As a result of market conditions, the restraints of courses for the masses in major subjects and the heavy student workload in the bachelor model, it is indeed possible that eLearning will not be able to fulfill its intended function of enhancing the quality of teaching
(1) AFT: American Federation of Teachers. Higher Education Department: Technology Review. Key Trends, Bargaining Strategies and Educational Issues. 2003 [ http://www.aft.org/pubs-reports/higher_ed/Tech.pdf ] (last check 2006/11/17)
(2) Allen, I.E.; Seaman, J.: Sizing the Opportunity: The Quality and Extent of Online Education in the United States 2002 and 2003. Sloan-C 2003.
(3) Allen, I.E.; Seaman, J.: Entering the Mainstream: The Quality and Extent of Online Education in the United States 2003 and 2004. Sloan-C 2004.
(4) Anderson, B.C.: Digital Education: The Legitimacy of the Higher Education Virtual Campus Accountability, Credibility and Accreditation. In: DESIEN vol. 7 v. 6. Juli 2002 [http://www.uwex.edu/disted/desien/2002/0207/full.htm]. (last check 2006/11/17)
(5) Berker, A.; Horn, L.: Work First, Study Second: Adult Undergraduates Who Combine Employment and Postsecondary Enrollment (NCES 2003-167).
(6) Bok, D.: Universities in the Marketplace. The Commercialization of Higher Education. Princeton, Princeton University Press 2003.
(7) Bowen, W.G.; Bok, D.: The Shape of the River: Long-Term Consequences of Considering Race in College and University Admissions. Princeton University Press, Princeton, 1998.
(8) Bradburn, E.M.; Hurst, D.G.: Community College Transfer Rates to 4-Year Institutions Using Alternative Definitions of Transfer. In: Education Statistics Quarterly ed. NCES, 3, 2001, Issue 3, Topic: Methodology.
(9) Capelli, G.: E-Learning in the Postsecondary Education-Market: A View from Wall Street. In: M.S. Pittinsky (Hrsg.): The Wired Tower. Perspectives on the Impact of the Internet on Higher Education. Pearson Education - Prentice Hall, Upper Saddle River, NJ, 2003, S. 41-63.
(10) CCC: California Community Colleges: Distance Education Report. Fiscal Years 1995-1996 through 1999-2000, presented by the Educational Services and Economic Development Division and the Chancellor's Office, 2001
(11) CCC: California Community Colleges: Distance Education Report Fiscal Years 1995-1996 through 1999-2000, August 2001, summarized by Martin Hittelman, 2001
(12) CCC: California Community Colleges (2003): Distance Education Report 7.2. May 5-6, 2003, presented by the Board of Governors. An Update and adjusted version of the very open statements from a report presented by CCC (2001), 2003.
(13) CCC: Distance Education Report: Fiscal Years 1995-96 through 2003-04. Educational Services Division, M. Davies/L. Woodyard/K. Nather, Board of Governors Meeting, May 2, 2005 [ http://www.cccco.edu/executive/bog/agendas/attachments%5F0705/0505%5Fde%5Freport.ppt ]. (last check 2006/11/17)
(14) CHEA: Council for Higher Education Accreditation: Distance Learning in Higher Education 1999.
(15) CHEA: Council for Higher Education Accreditation: Monograph Series 2001, Number 1: see Eaton (2001).
(16) CHEA: Council for Higher Education Accreditation: Monograph Series 2002, Number 1: Accreditation and Assuring Quality in Distance Learning.
(17) Eaton, J.S.: Distance Learning: Academic and Political Challenges for Higher Education Accreditation. CHEA Monograph Series 2001, Number 1.
(18) Epper, R.M.; Garn, M.: Virtual College & University Consortia. A National Study. State Higher Education Executive Officers (SHEEO) and the Western Cooperative for Educational Telecommunications (WCET) 2003 [ http://www.wcet.info/resources/publications/vcu.pdf ]. (not available 2006/11/17)
(19) Heterick, B./Twigg, C. (2003): The Learning MarketSpace. 1 February 2003 [ http://www.center.rpi.edu/LForum/LM/Feb03.html ].
(20) Hvorecky, J.: Can E-learning break the Digital Divide? [http://www.eurodl.org/materials/contrib/2004/Hvorecky.htm]. , 2004 (last check 2006/11/17)
(21) Kvavik, R.B.; Caruso, J.B. et al: ECAR Study of Students and Information Technology 2004: Convenience, Connection, and Control, 2004 [Summary; http://www.educause.edu/ResearchStudies/1010 ]. (last check 2006/11/17)
(22) Kvavik, R.B./Caruso, J.B.: ECAR Study of Students and Information Technology 2005: Convenience, Connection, Control, and Learning. vol 6, 2005 [http://www.educause.edu/ecar]. (last check 2006/116/17)
(23) Levine, A.: Higher Education: A Revolution externally, Evolution internally. In: M.S. Pittinsky (Hrsg.): The Wired Tower. Perspectives on the Impact of the Internet on Higher Education. Pearson Education: Prentice Hall: Upper Saddle River, NJ 2003, S. 13-39.
(24) Lorenzo, G.: Distance Education in Canada. In: Educational Pathways July/August 2004 [ http://www.edpath.com/canada.htm ]. (last check 2006/116/17)
(25) Mayer, H.O.; Treichel, D.: Handlungsorientiertes Lernen und eLearning. Oldenbourg: München, Wien 2004.
(26) NPEC: National Postsecondary Education Cooperative. How Does Technology Affect Access in Postsecondary Education? What Do We Really Know? (NPEC 2004-831), prepared by Ronald A. Phipps for the National Postsecondary Education Cooperative Working Group on Access-Technology. Washington, DC 2004.
(27) NTIA: National Telecommunications and Information Administration (NTIA): Falling Through The Net: Defining The Digital Divide. A Report on the Telecommunications and Information Technology Gap in America. July 1999 [ http://www.ntia.doc.gov/ntiahome/fttn99/contents.html ]. (last check 2006/11/17)
(28) NTIA: National Telecommunications and Information Administration (NTIA): Falling Through The Net: Toward Digital Inclusion. A Report on Americans' Access to Technology Tools. October 2000 [ http://search.ntia.doc.gov/pdf/fttn00.pdf ]. (last check 2006/11/17)
(29) Resnick, M.: Rethinking Learning in the Digital Age. -In: G. Kirkman (Hrsg.): The Global Information Technology Report: Readiness for the Networked World. Oxford University Press 2002 [ http://www.media.mit.edu/~mres/papers/wef.pdf ] und [ http://www.cid.harvard.edu/cr/pdf/gitrr2002_ch03.pdf ]. (last check 2006/11/17)
(30) Schulmeister, R.: Virtuelle Universität - Virtuelles Lernen. Oldenbourg: München 2001.
(31) Sloan Consortium: Sloan-C View ISSN 1541-2806 Volume 2 Issue 2 - April 2003
(32) Sloan-C: The Sloan Consortium: Sizing the Opportunity. The Quality and Extent of Online Education in the United States, 2002 and 2003.
(33) Sloan-C: The Sloan Consortium: Entering the Mainstream: The Quality and Extent of Online Education in the United States, 2003 and 2004.
(34) Terry, N.: Assessing Enrollment and Attrition Rates for the Online MBA. -In: The Journal Online. Februar 2001 [ http://www.thejournal.com/magazine/vault/A3299.cfm ]. (last check 2006/11/17)
(35) Thomas, U. et al.: Anytime, Anywhere - IT-supported learning in the USA. Report of a study trip to the USA, published by Neue Medien in der Bildung 2001.
(36) Thompson, M. M.: Distance Learners in Higher Education. In: C. C. Gibson (ed): Distance Learners in Higher Education: Institutional Responses for Quality Outcomes. Madison, WI: Atwood Publishing, 1998, S. 10-18 [ http://www1.worldbank.org/disted/Teaching/Design/kn-02.html ]. (last check 2006/11/17)
(37) Timmis, S.; O'Leary, R. et al.: Different Shoes, Same Footprints? A Cross-Disciplinary Evaluation of Students' Online Learning Experiences: Preliminary Findings from the SOLE Project. In: Journal of Interactive Media in Education 2004 [ http://www-jime.open.ac.uk/2004/13 ]. ]. (last check 2006/11/17)
(38) Twigg, C.: Center for Academic Transformation, Rensselaer Polytechnic Institute: Quality, Cost and Access: The Case for Redesign. In: M.S. Pittinsky (Hrsg.): The Wired Tower. Perspectives on the Impact of the Internet on Higher Education. Pearson Education: Prentice Hall: Upper Saddle River, NJ, 2003, S. 111-143.
(39) U.S. Department of Commerce: National Telecommunications and Information Administration (NTIA): Falling Through the Net: Defining the Digital Divide. A Report on the Telecommunications and Information Technology Gap in America. 1999.
(40) U.S. Department of Commerce: Economic and Statistics Administration: National Telecommunications and Information Administration: Falling Through the Net. Toward Digital Inclusion. A Report on Americans' Access to Technology Tools. 2000.
(41) U.S. Department of Commerce: Economics and Statistics Administration: U.S. Census Bureau (2004): Educational Attainment in the United States: Population Characteristics 2003.
(42) U.S. Department of Education, National Center for Education Statistics: Distance Education at Postsecondary Education Institutions: 1997-98. NCES 2000-013, by Laurie Lewis, Kyle Snow, Elizabeth Farris, Douglas Levin. Bernie Greene, project officer. Washington, DC: 1999.
(43) U.S. Department of Education, National Center for Education Statistics: Distance Education Instruction by Postsecondary Faculty and Staff: Fall 1998, NCES 2002-155, by Ellen M. Bradburn. Project Officer: Linda Zimbler. Washington, DC: 2002.
(44) U.S. Department of Education, National Center for Education Statistics: Teaching Undergraduates in U.S. Postsecondary Institutions: Fall 1998, (NCES 2002-209), by Xianglei Chen. Project Officer: Linda J. Zimbler. Washington, DC: 2002.
(45) U.S. Department of Education, National Center for Education Statistics: A Profile of Participation in Distance Education, NCES 2003-154, by Anna C. Sikora. Project Officer: C. Dennis Carroll. Washington, DC: 2002.
(46) U.S. Department of Education, National Center for Education Statistics: The Condition of Education 2003, NCES 2003-067, Washington, DC: U.S. Government Printing Office, 2003.
(47) U.S. Department of Education, National Center for Education Statistics: Distance Education at Degree-Granting Postsecondary Institutions: 2000-2001, NCES 2003-017, by Tiffany Waits and Laurie Lewis. Project Officer: Bernard Greene. Washington, DC: 2003.
(48) U.S. Department of Education, National Center for Education Statistics: Work First, Study Second: Adult Undergraduates Who Combine Employment and Postsecondary Enrollment, NCES 2003-167, by Ali Berker and Laura Horn. Project Officer: C. Dennis Carroll. Washington, DC: 2003.
(49) U.S. Department of Education, National Center for Education Statistics: Community College Students: Goals, Academic Preparation, and Outcomes, NCES 2003-164, by Gary Hoachlander, Anna C. Sikora, and Laura Horn. Project Officer: C. Dennis Carroll. Washington, DC: 2003.
(50) U.S. Department of Education, National Center for Education Statistics: Projections of Education Statistics to 2013 (NCES 2004-013) by Debra E. Gerald and William J. Hussar. Washington, DC: U.S. Government Printing Office 2003.
(51) U.S. Department of Education, National Center for Education Statistics: The Condition of Education 2004 (NCES 2004-077). Washington, DC: U.S. Government Printing Office 2004. see: Wirt, Choy et al 2004.
(52) U.S. Department of Education, National Center for Education Statistics: The Condition of Education 2004 (NCES 2004-077). Washington, DC: U.S. Government Printing Office 2004.
(53) U.S. Department of Education, National Center for Education Statistics: The Condition of Education 2005 (NCES 2005-094). Washington, DC: U.S. Government Printing Office.
(54) U.S. General Accounting Office (GAO): Distance Education. Improved Data on Program Costs and Guidelines on Quality Assessments Needed to Inform Federal Policy. February 2004 [ http://www.gao.gov/new.items/d04279.pdf ]. (last check 2006/11/17)
(55) Weiler, H.:Reform of third level education and und digitalization. Challenges for teaching, Management, knowledge transfer and research. Keynote to workshop dialog for the Rectors of the universities in Nordrhein-Westphalia on "The Digital future of universities: potential for innovation and structural change" in Hagen 4. October 2005 [ http://www.stanford.edu/people/weiler ]. (last check 2006/11/17)
(56) Wirt, J.; Choy, S. et al: The Condition of Education 2004 (NCES 2004-077). U.S. Department of Education, National Center for Education Statistics. Washington, DC: U.S. Government Printing Office. Additional statistics, 2004:
• Indicator 29 Employees Who Study;
• Indicator 30 Top 30 Postsecondary Courses;
• Indicator 31 Remedial Course taking;
• Indicator 32 Distance Education at Postsecondary Institutions.
(57) Zemsky, R.; Massy, W.F.: Thwarted Innovation. What Happened to e-learning and Why. A Final Report for The Weatherstation Project of The Learning Alliance at the University of Pennsylvania in cooperation with the Thomson Corporation. The Learning Alliance at the University of Pennsylvania, 2004 [ http://www.irhe.upenn.edu/WeatherStation.html ]. (last check 2006/11/17)
[1] In the USA traditional on-campus universities are referred to as brick-and-mortar universities or briefly brick universities.
[2] "Community colleges were developed, and still exist, for two major purposes. The first is to serve as a bridge from high school to college by providing courses for transfer toward a bachelor's degree (B.A. or B.S.). Four out of 10 college-bound high-school graduates start their college education this way. The second function of community colleges is to prepare students for the job market by offering entry-level career training as well as courses for adult students who want to upgrade their skills for workforce re-entry or advancement." [ http://www.collegeboard.com/article/0,3868,4-21-0-8169,00.html ]
[3] This is the first time that we have come across the term Associate Degree. It is an academic degree below the bachelor degree that was not taken into consideration in the Bologna Study Reform in Europe. In section 3, I will try to explain in greater detail the exact nature of these degrees and why the majority of online courses serve the acquisition of Associate Degrees.
[4] Private 2-year colleges are not included in the NCES statistics because the number of their online courses was too small.
[5] NCES, The Conditions of Higher Education 2005, Supplemental Notes: Note 8: Classification of Postsecondary Education Institutions, classifies 3 levels of post secondary Institutes based on the degree they award:
4-year-and-above institutions: Institutions or branches that award at least a 4-year degree or higher award in one or more programs, or a postbaccalaureate, postmaster's, or post-first-professional certificate.
2-year but less-than-4-year institutions: Institutions or branches that confer at least a 2-year formal award (certificate, diploma, or associate's degree), or that have a 2-year program creditable toward a baccalaureate degree.
Less-than-2-year institutions: Institutions or branches that have programs lasting less than two years that result in a terminal occupational award or are creditable toward a degree at the 2-year level or higher.
Postsecondary institutions are further divided according to these criteria: degree-granting versus non degree-granting; type of financial control; and Title IV-participating versus not Title IV-participating.
[6] While traditional universities are called brick universities, virtual universities are referred to as "click universities". Arthur Levine coined the term brick-and-click universities for Blended Learning-Institutions and the play on words "click education" for online studies.
[7] This list was issued for a specific reason that has no connection with the topic being discussed here. It had to do with a case where those, who were studying solely online, were to be refused federal student aid in order to avoid fraud. The Chronicle of Higher Education 27.2.2004 wrote: "The law, known as the 50-percent rule, bars colleges from participating in federal financial-aid programs if at least half their students study online or if more than half the institutions' courses are offered at a distance. The law is aimed at preventing fraudulent distance-learning institutions from exploiting federal aid programs" [ http://chronicle.com/errors.dir/noauthorization.php3?page=/daily/2004/02/2004022703n.htm ].
[8] Not only because several figures give rise to speculation. For instance the Western Governors' University, which came into being with the aid of a lot of publicity from no less than 16 U.S. states, has with less than 300 students shrunk to the level of a private university (WGU; Schulmeister 2001, p.95ff)(30). The Jones International University does not have the numbers to ensure good business either (JIU; Schulmeister 2001, p 94f.)(30).
[9] The virtual branch of the Phoenix University (Schulmeister 2001, p.64ff.)(30) can fall back on over 80 distance learning centers distributed throughout the U.S and can build on a tradition of distance education for working adults which was in place long before the internet boom. The University of Maryland has several foreign distance learning centers at their disposal and a close cooperation with the Open University Britain. The University College [ http://www.umuc.edu/ ] which makes up the 13 institute university system of Maryland aims to attract working adults.
[10] I cannot refrain from mentioning that there are even state-supporting courses such as Bioterrorism and Public Health Emergencies.
[11] Published by the Western Cooperative for Educational Telecommunications (WCET), [ http://www.wcet.info/resources/publications/conguide/conguidb.htm ], supporting WICHE.
[12] EDUCAUSE known since 1964 under the name EDUCOM [ http://www.educause.edu/ir/library/html/erm/erm98/erm9853.html ] was especially known for its annual congresses and its awards for multimedia applications. In 1997 CAUSE and EDUCOM united and became EDUCAUSE. CAUSE was an association responsible for the development and management of IT systems in colleges since 1962. EDUCOM was also involved with the development of IT systems in colleges but more from a didactical point of view.
[13] ECAR is an acronym for Educause Center for Applied Research, an institute of EDUCAUSE [ http://www.educause.edu/ ].
[14] Especially informative is the observation of the authors that more time is invested in playing games, downloading music and similar pastimes than in studying.
[15] For example: The Defense language Institute Foreign Language Center which awards an Associate of Arts in Foreign Language degree (AA/FL degree ) says "DLIFLC does not teach all the required general education courses a student needs to receive an AA/FL degree. To satisfy general education requirements, students must complete at least 27 semester units, which must include the minimum number of units indicated in each of these general education areas." [ http://www.dliflc.edu/daa/academic_admin/AcademicAdmin/AAdegreereq.pdf ]
[16] See Ellen M. Bradburn's und David G. Hurst's (2001) definition in the NCES-Report: "This report defines transfer as follows: initial enrollment at a community college followed by subsequent enrollment at any 4-year institution within the 5-year study period".
[17] The data is based on 1,235 questionaires compiled by 30 July 2003. The data was sent by schools to Class.com or compiled by using questionaires in partner programs.
[18] SAT is an Acronym for Scholastic Aptitude Test, which most American Universities use an entrance exam [ http://www.collegeboard.com/ ]. It has been subject to political and methodical criticism for some time now (Bowen & Bok 1998, p. 16)(7).
[19] Although the statistical category DED#60 referred to computer-aided learning in the previous statistics, CAI and Internet-based-Learning are listed separately in this statistic.
[20] These are people with degrees in health, law and religion [ http://www.universities.com/On-Campus/FirstProfessional_degree.html ]. The following professions are, amongst others, also included: Chiropractic (DC DCM); Dentistry (DDS DMD); Divinity and-or Ministry (BD MDiv); Law (LLB JD); Medicine (MD); Naturopathic Medicine; Optometry (OD); Ordination Other; Osteopathic Medicine (DO); Pharmacy (B Pharm PharmD); Podiatry (DPM DP PodD); Rabbinical And Talmudic Stu (MHL and-or Rav); Veterinary Medicine (DVM).
[21] These misgivings were used against the accreditation of whole virtual universities e.g. Byron C. Anderson in Distance Education Systemwide Newsletter (D E S I E N Volume 7.6 July 2002). Not all accreditation agencies are recognised by the state [ http://www.uwex.edu/disted/desien/2002/0207/full.htm ]. Anderson mentions the case of Columbia State University, which was sued by the state of Louisiana in 1998 for the sale of cheap degrees. In May 2003 the Council for Higher Education Accreditation (CHEA) warned against [ http://www.chea.org/pdf/fact_sheet_6_diploma_mills.pdf ] "Diploma Mills" and "Accreditation Mills".
[22] A tip: The report on the examinations carried out by the UCF RITE! can also be watched on video [ http://pegasus.cc.ucf.edu/~rite/video.htm ]. Doing this, you might experience what American didactic experts consider a "good" method of presenting.
[23] In this context one can regard SAT scores as competence levels; see the criticism of Derek Bok (2003)(6) and William Bowman (1998)(7). Here, I am taking on the language used by the study and, for the purpose of this argument will temporarily put aside my criticism on the SAT as a way of measuring competence levels.